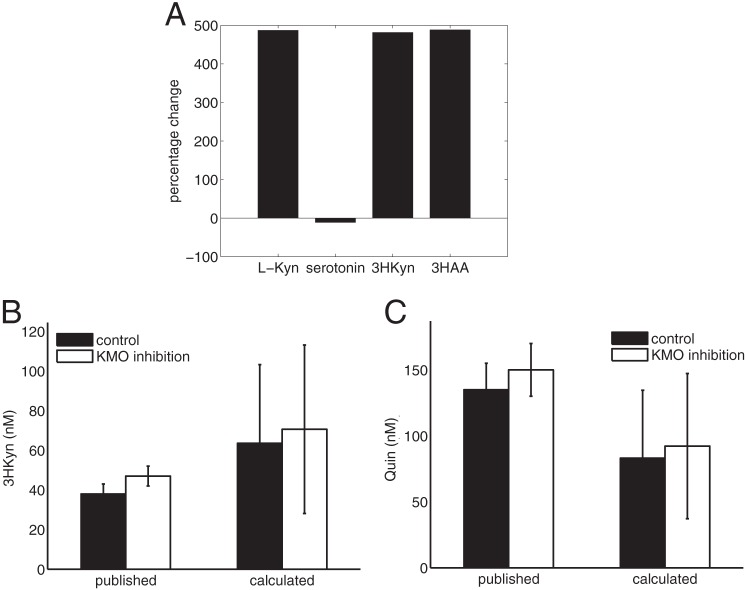
FIGURE 4.
Simulation of the influence of liver metabolism on brain kynurenine metabolites. A, percentage change of selected metabolite concentrations calculated in the combined brain-liver model relative to the isolated brain model. Shown are changes in brain l-Kyn concentrations (B) and changes in Quin concentrations (C) upon reduction of liver KMO activity to 10%. The simulation results are presented as a range of concentrations because the reported range of free tryptophan (4–16 μm, see Table 2) was used as input for the model. The calculated values are compared with measurements reported by Zwilling et al. (39).

