
FIGURE 5.

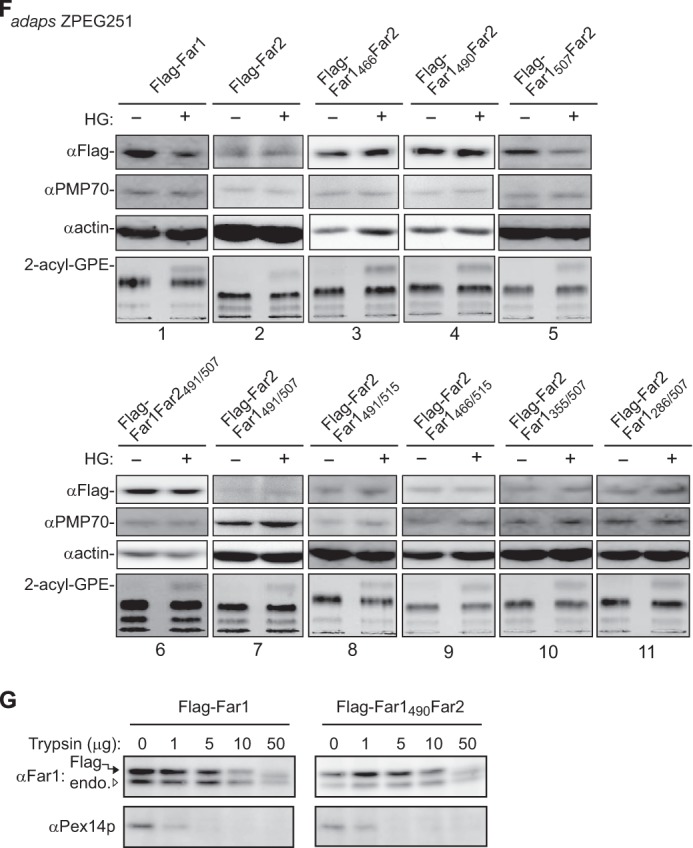
The transmembrane-flanking region of Far1 is required for its plasmalogen-dependent degradation. A, FLAG-tagged Far1 and Far2 were expressed in ZPEG251 cells, and their membrane insertion was assessed by carbonate extraction as described in Fig. 1B. P and S are membrane pellet and soluble fractions, respectively. B, the membrane topology of FLAG-Far2-HA2 in CHO-K1 cells was assessed by differential membrane permeabilization with digitonin as described in Fig. 1D. Scale bar = 5 μm. C, MCF7 cells were cultured for 2 days in the presence (+) or absence (−) of plasmenylethanolamine (PlsEtn). The expression levels of endogenous Far1 (solid arrowhead) and Far2 (open arrowhead), Pex14p, and actin were assessed by immunoblotting with antibodies to Far2, Pex14p, and actin, respectively. Note that anti-Far2 antibody recognized both Far1 and Far2. An in vitro-translated Far2 was loaded in the same SDS-PAGE. The same blot for Far1 and Far2 at a longer exposure is also shown (second panel). The plasmalogen level was detected as 2-acyl-GPE and is shown in the fifth panel. Dots indicates a nonspecific band. D, FLAG-Far1 and FLAG-Far2 were transfected to MCF7 cells. Cells were divided into two dishes and cultured for 2 days in the presence (+) or absence (−) of HG. Proteins were detected by Western blotting with the antibodies indicated on the left. FLAG-tagged Far proteins were quantified by a LAS-4000 mini lumino image analyzer. Relative expression levels of FLAG-Far1 and FLAG-Far2 are shown, where the levels of respective Far proteins in untreated MCF7 cells were designated as 100. Scale bars represent the mean ± S.D. of three experiments. *, p < 0.05; Student's t test versus untreated MCF7 cells. E, schematic of Far1 and Far2 chimeric fusion proteins. Plasmalogen-dependent degradation and enzyme activity of these fusion proteins are summarized on the right. n.d., not done. The relative expression levels of Far1-Far2 chimera proteins were determined, where the expression levels of respective Far1-Far2 chimera proteins in plasmalogen-deficient ZPEG251 cells were designated as 100. Numbers represent the mean ± S.D. of three experiments. *, p < 0.05; Student's t test versus untreated ZPEG251. F, ZPEG251 cells were transfected with FLAG-Far1, FLAG-Far2, or the chimeric fusion proteins and then cultured in the presence (+) or absence (−) of HG for 48 h. The levels of each of the fusion proteins, PMP70, and actin were assessed by labeling with their corresponding antibodies. The plasmalogen level is shown in the bottom panel. G, PNS prepared from ZPEG251 cells expressing FLAG-Far1 or FLAG-Far1490Far2 was digested with trypsin. The digestion was terminated by the addition of trichloroacetic acid, and the protease sensitivities of FLAG-Far1 and FLAG-Far1490Far2 were assessed by immunoblotting with antibodies against Far1 and Pex14p. Solid and open arrowheads indicate FLAG-tagged and endogenous Far proteins, respectively.