FIGURE 6.

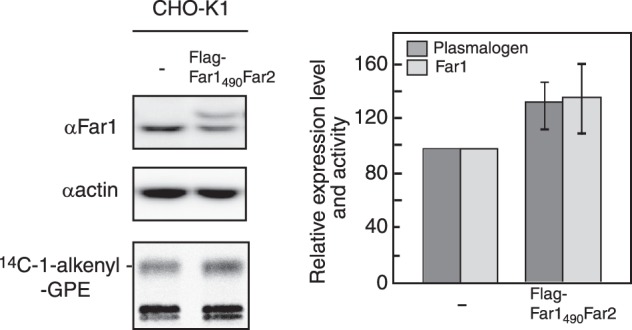
Expression of FLAG-Far1490Far2 increased plasmalogen synthesis. Plasmalogen biosynthesis was examined in CHO-K1 cells stably expressing FLAG-Far1490Far2 by labeling with [14C]palmitate in the presence of 2 μm ethanolamine for 5 h. Levels of endogenous Far1, FLAG-Far1490Far2, and actin were assessed by immunoblotting using antibodies against Far1 and actin. Band intensities were measured with a LAS-4000 mini lumino image analyzer. FLAG-Far1490Far2 migrated slightly slower than endogenous Far1. Relative expression levels of Far1 or Far1 plus FLAG-Far1490Far2 (light gray bars) and plasmalogen biosynthesis (dark gray bars) are shown, where levels in control CHO-K1 cells were designated as 100. Scale bars represent the mean ± S.D. of three experiments.
