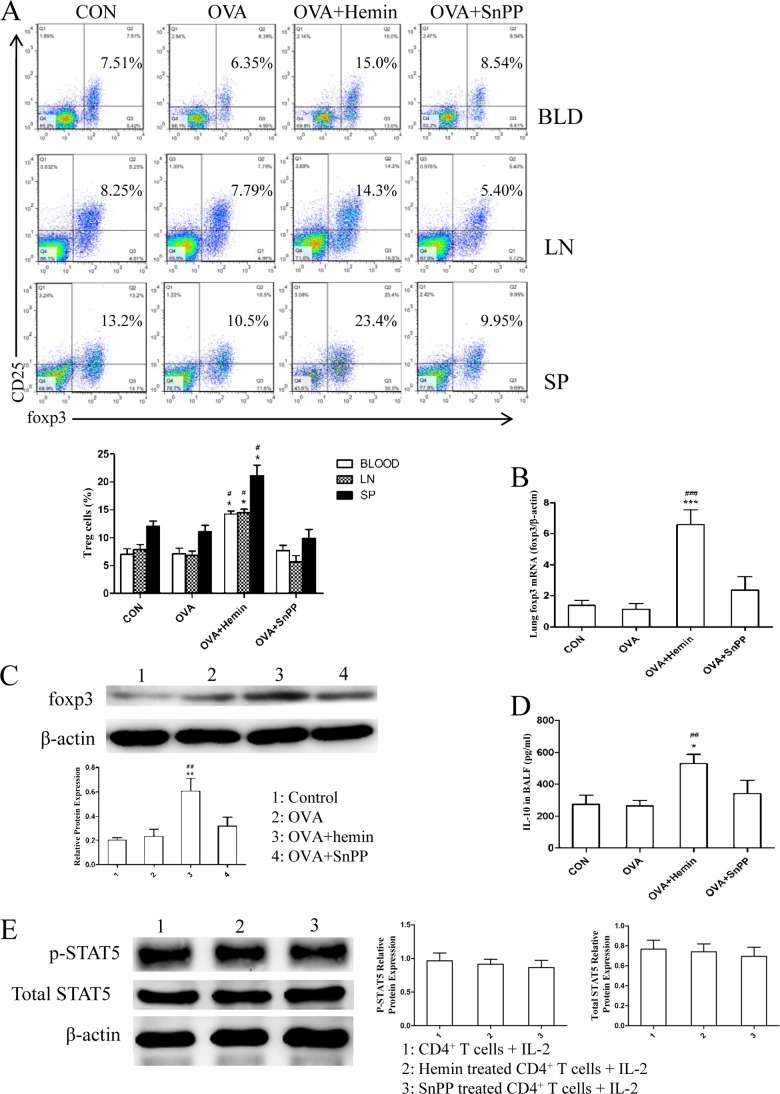
FIGURE 6.
HO-1 up-regulates Tregs and enhances their functions in vivo but has no significant effect on STAT5 phosphorylation. A, flow cytometric analysis of peripheral blood (BLD), mediastinal lymph node (LN), and spleen (SP) cells isolated from DO11.10 mice in control, OVA, OVA + hemin, and OVA + SnPP groups. Numbers in the upper right quadrants indicate the percentages of Tregs (CD4+CD25+Foxp3+) gated on CD4+ T cells (* compared with control group: *, p < 0.05; #, with OVA group; #, p < 0.05). Each symbol in the graph represents an individual mouse (n = 6). B, real-time PCR analysis of Foxp3 mRNA in lung tissues isolated from four groups (* compared with the control (CON) group: ***, p < 0.001; # compared with the OVA group: ###, p < 0.001). C, Western blot analysis of Foxp3 protein expression in lung tissues extracted from four groups. β-Actin was used as the loading control. Densitometry analysis was performed by normalizing to β-actin levels (* compared with the control group: **, p < 0.01; # compared with the OVA group: ##, p < 0.01). D, ELISA analysis of IL-10 in BALF collected from four groups (* compared with the control group: *, p < 0.05; # compared with the OVA group: ##, p < 0.01). E, Western blot analysis of purified CD4+ T cells isolated from DO11.10 mice pretreated with or without hemin and SnPP and cultured with IL-2 for 1 h. β-Actin was used as loading control. Densitometry analysis of p-STAT5 and total STAT5 was performed by normalizing to β-actin levels. All results shown are representative of three independent experiments.

