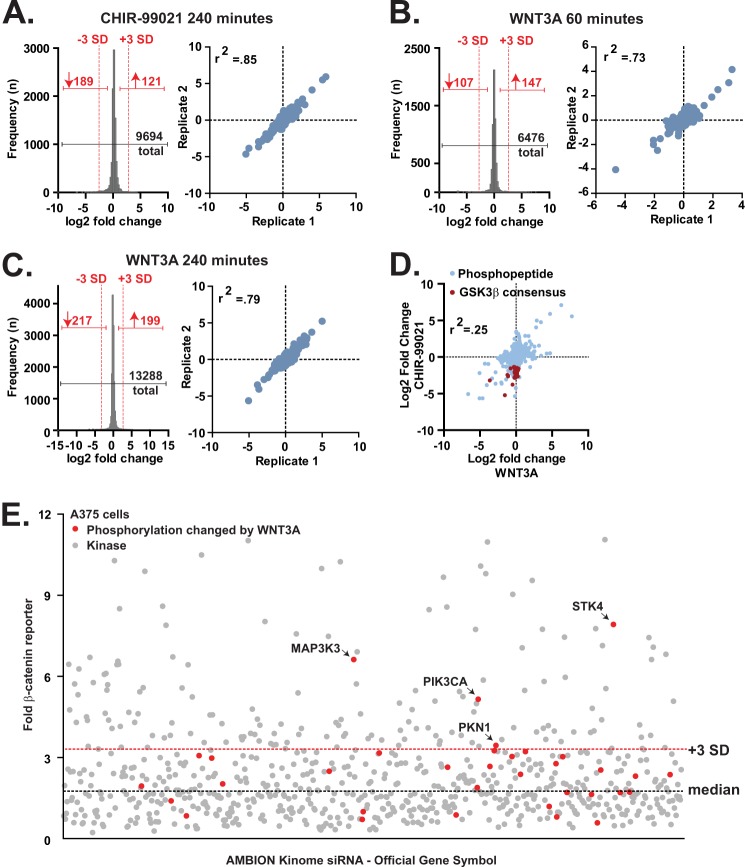
FIGURE 1.
Phosphoproteomics and siRNA screening identify PKN1 as a candidate kinase involved in Wnt/β-catenin signaling. A–C, histograms (left panel) and scatter plots (right panel) showing the distribution of the log2 -fold change over vehicle treatment for phosphopeptides quantified from replicate CHIR-99021-stimulated (5 μm for 240 min; A) and WNT3A-stimulated (100 ng/ml for 60 min (B) and 100 ng/ml for 240 min (C)) samples. The red dotted lines represent the -fold change value corresponding to −3.0 and +3.0 population standard deviations from the median value of all peptides in the experiment. D, scatter plot showing the fold change values of phosphopeptides that were quantified from cells treated with CHIR-99021 and with WNT3A (60 min). Phosphopeptides containing the GSK3 consensus sequence SpXXXSp that decreased in abundance (<−3.0 population standard deviations from the median) following treatment with CHIR-99021 are highlighted with a red color. E, scatter plot of a kinome-based siRNA screen in A375 melanoma cells stably expressing BAR with each dot representing a known or predicted kinase. Red dots highlight proteins that contain phosphorylation sites that are altered in abundance following WNT3A stimulation (>3.0 or <−3.0 population standard deviations from the median). The red dotted line represents the -fold change equal to 3 population standard deviations greater than the median (black dotted line).

