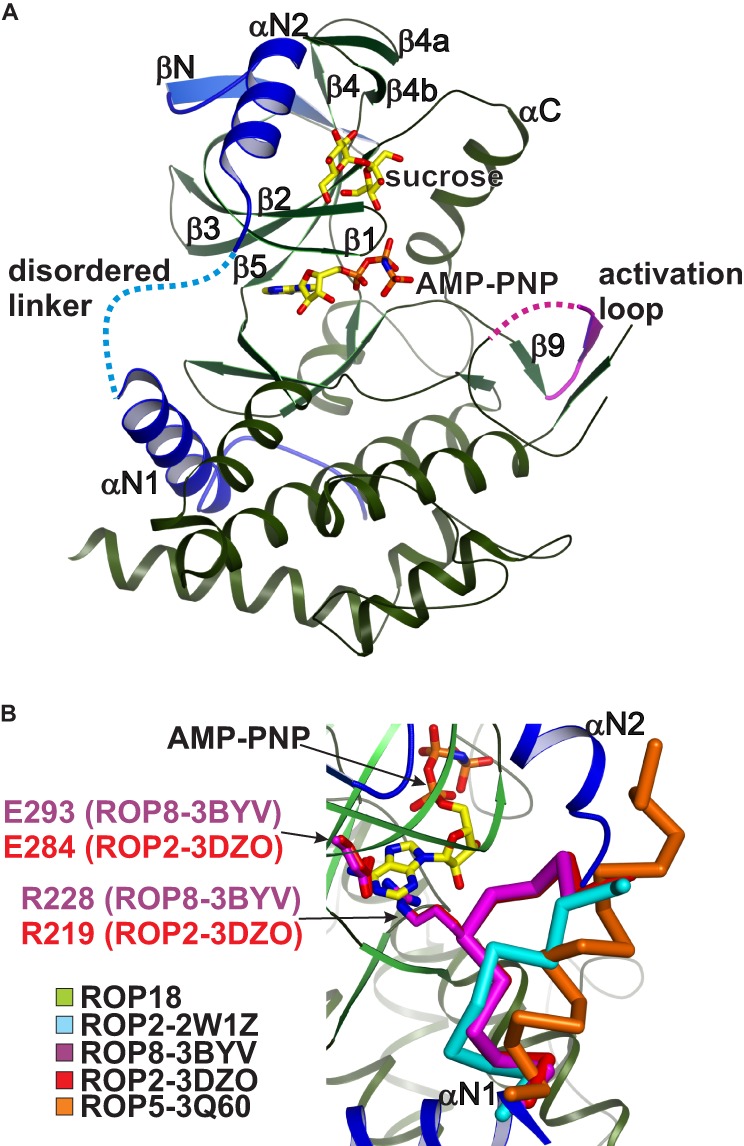
FIGURE 1.

Crystal structure of the ROP18 kinase domain. A, schematic rendering of the ROP18 kinase domain with the N-terminal subdomain highlighted in blue and disordered regions indicated by dotted lines. The bound sucrose and AMP-PNP molecules are shown in stick rendering with yellow carbons. B, close-up view of the αN1-αN2 linker within the N-terminal subdomain. Although this linker is disordered in ROP18, in ROP2–3DZO and ROP8–3BYV the linker adopts an autoinhibitory conformation (red and purple Cα traces, respectively) stabilized by an Arg-Glu salt bridge (stick rendering) that precludes ATP binding. The corresponding regions from ROP2–2W1Z and ROP5–3Q60 are shown as cyan and orange Cα traces, respectively.
