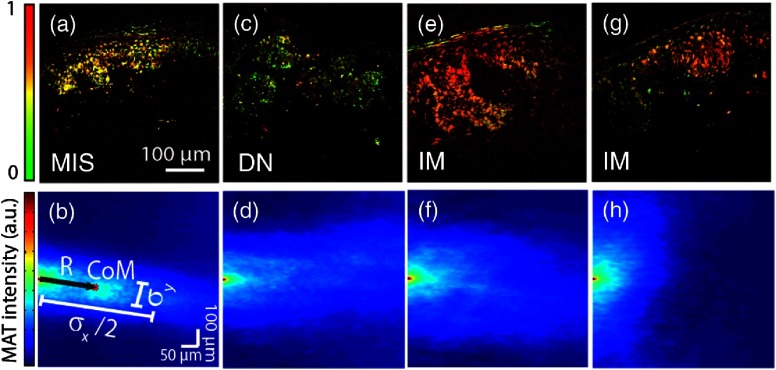
Fig. 1.
Representative percent eumelanin images along with their two-dimensional (2-D) morphological autocorrelation transformation (MAT). Because the MAT is symmetric about the origin, only the right half-plane is depicted. (b) Illustrates the parameters extracted from the MAT to quantify image structure, see text for details.

