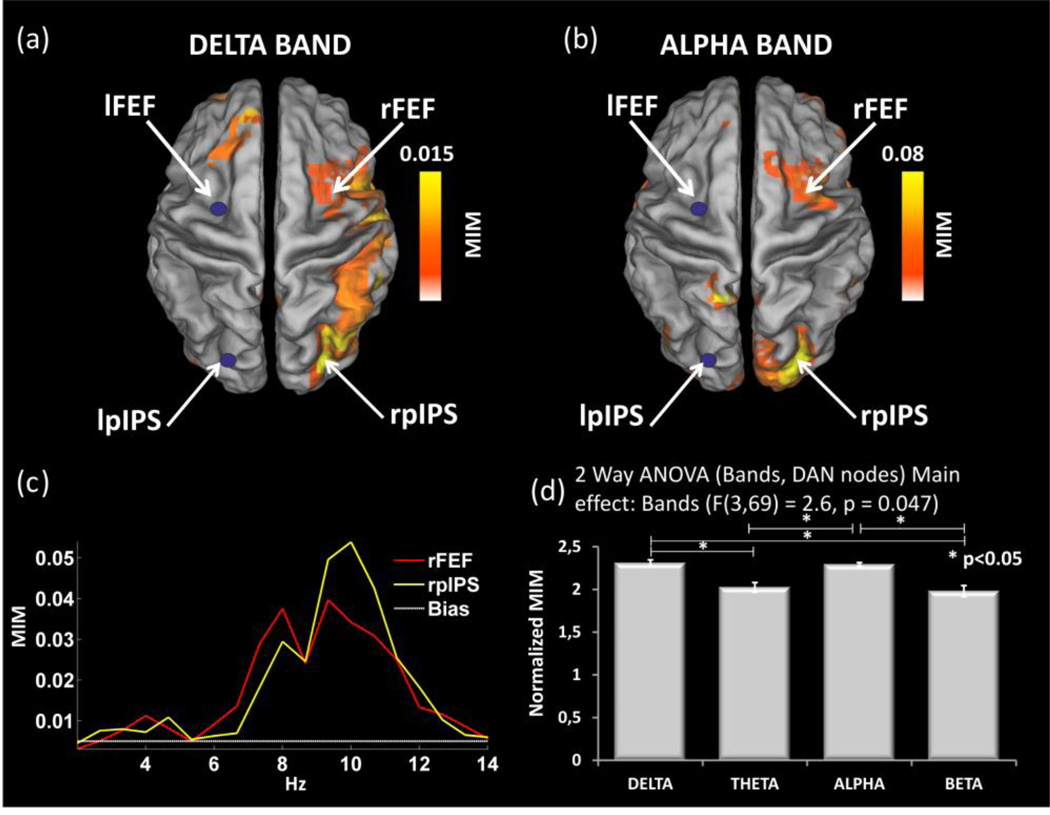
Figure 3.
(a, b) Whole brain left FEF and PIPS conjunction maps of MIM values in delta and alpha frequency bands. These maps reveal out of phase interactions between the seeds and DAN nodes in the contralateral hemisphere. This interaction is frequency specific, as shown by the plot as a function of frequency (c). The seed locations are marked by a blue dot and the network node locations are marked by white arrows and labeled in accordance with the coordinates listed in Table 1. (d) Post-hoc results for the 2-WAY ANOVA with factors Frequency Bands and DAN Nodes (F(3,69)=2.6, p=0.047) for MIM values. The main effect concerns Frequency Bands: MIM values within-DAN in the alpha and delta bands are statistically significantly greater than those in theta and beta.

