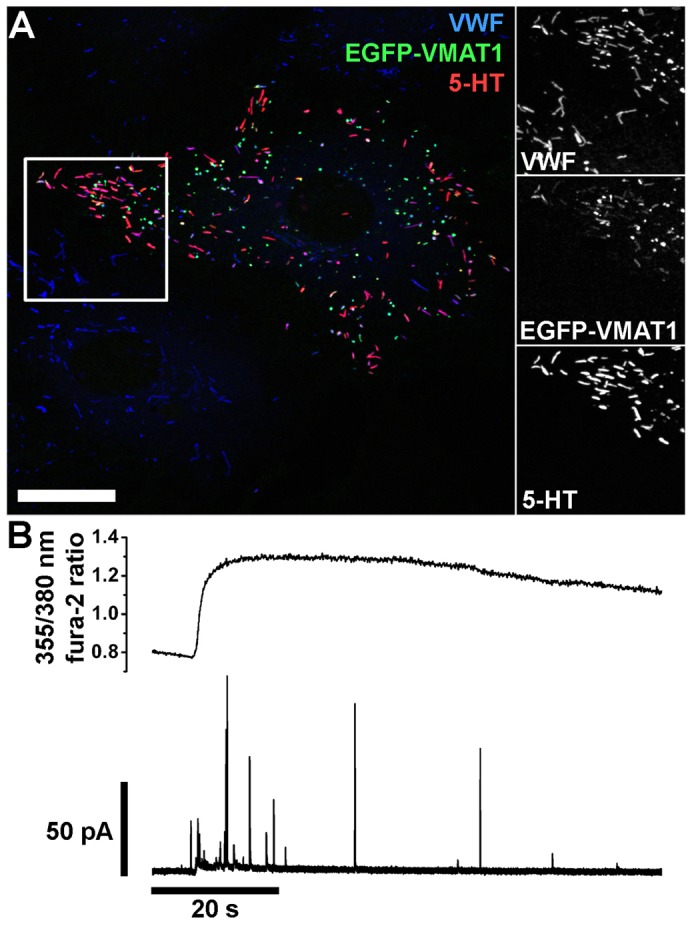
Fig. 2.

EGFP–VMAT1 localises to WPBs, and results in the appearance of WPB 5-HT immunoreactivity and current spikes during endothelial cell stimulation. (A) HUVECs expressing EGFP–VMAT1 and immunolabelled with specific antibodies to VWF (blue, rabbit Ab), EGFP (green) and 5-HT (red). Scale bar: 20 µm. Regions indicated by white boxes are shown in grey scale to the right at an expanded scale. (B) Simultaneous recording of fura-2 fluorescence ratio (top trace) and electrode current (bottom trace) from a single proregion–EGFP- and mCherry–VMAT1-expressing HUVECs following mechanical stimulation with the electrode.
