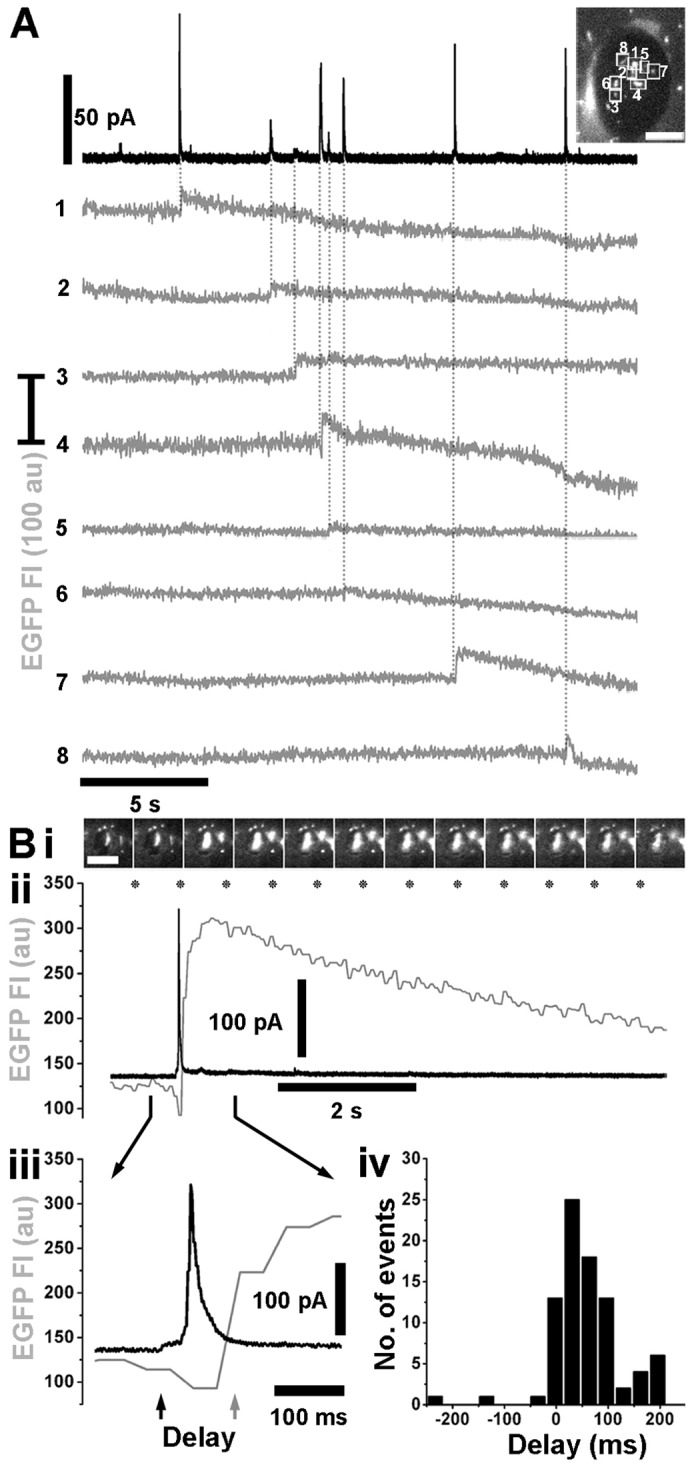
Fig. 3.

Current spikes are associated with WPB fusion. (A) Representative recording of electrode current (black trace) and fluorescence intensity of individual EGFP-labelled WPBs (grey traces, 1–8) in an mCherry–VMAT1 and proregion–EGFP co-expressing HUVEC. Positions of individual EGFP-labelled WPBs (numbered 1–8) beneath the electrode, just prior to stimulation, are shown in the image of the electrode footprint (top right). Scale bar: 5 µm. A current spike is associated with fusion of each WPB (marked by vertical dotted lines). (Bi) Image montage showing the fusion of a single proregion–EGFP-containing WPB isolated beneath an electrode. Images of EGFP fluorescence were acquired at 15 frames/second, and correspond to the times indicated by the asterisks in Bii. Scale bar: 5 µm. (Bii–iii) The temporal association between the increase in WPB EGFP fluorescence intensity, due to fusion (grey traces), and the onset of the current spike (black traces). There is a delay between the onset of the current spike (black arrow in Biii) and the onset of the rise in WPB EGFP fluorescence intensity (grey arrow in Biii). (Biv) A summary of the distribution of delay times (bin width, 33 ms; mean 57.4±7.27 ms, n = 84).
