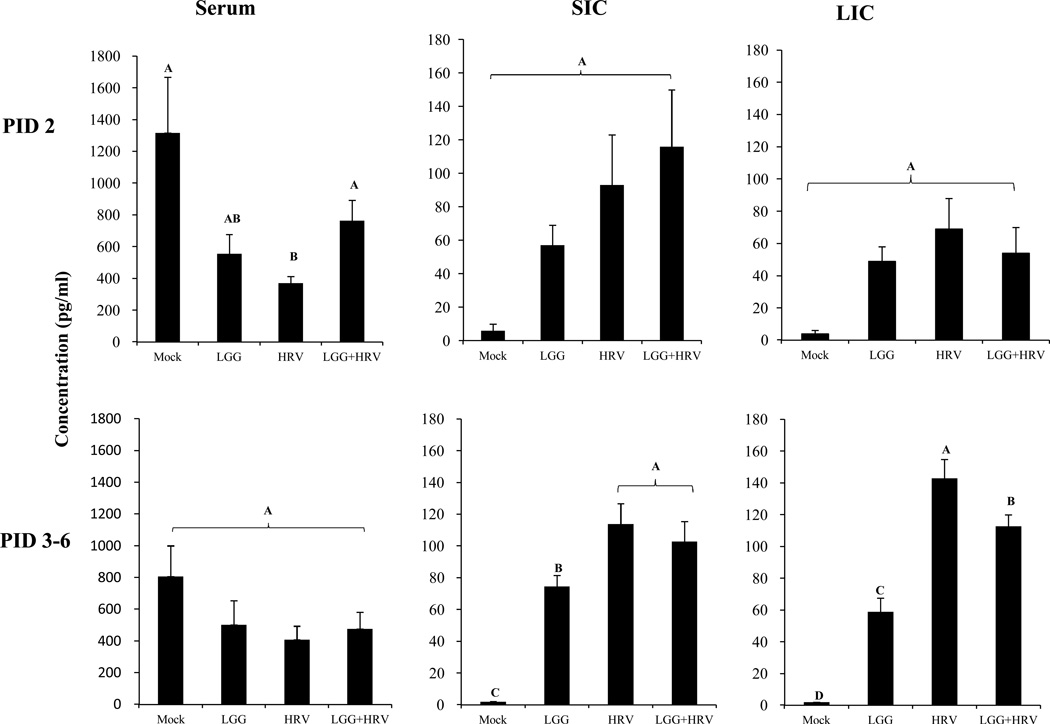
Fig. 6. Mean TGF-β concentrations in serum, SIC and LIC of Gn pigs.
The cytokine concentrations were measured by ELISA on PID 2–6. The data from PID 3–6 were combined within each group. Error bars indicate the standard error of the mean. Different letters (A, B, C, D) indicate significant difference among groups (Kruskal Wallis Test, p<0.05, n=4), whereas shared letters indicate no significant difference.

