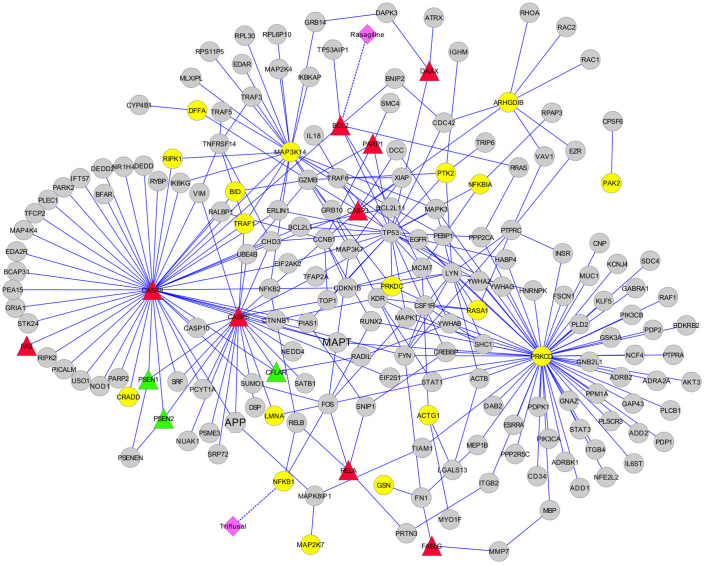
Figure 3. Representation of recovered HIV-NEF pathway and its first neighbor proteins in the temporal lobe network model.
The model has been enhanced with drug-target and biomarker expression information. Circular nodes in yellow show membership to the HIV-NEF pathway; square nodes in pink are approved drugs targeting the recovered pathway; triangle nodes represent potential biomarkers color coded for their expression levels in AD brain (red: over-expression; green: under-expression).

