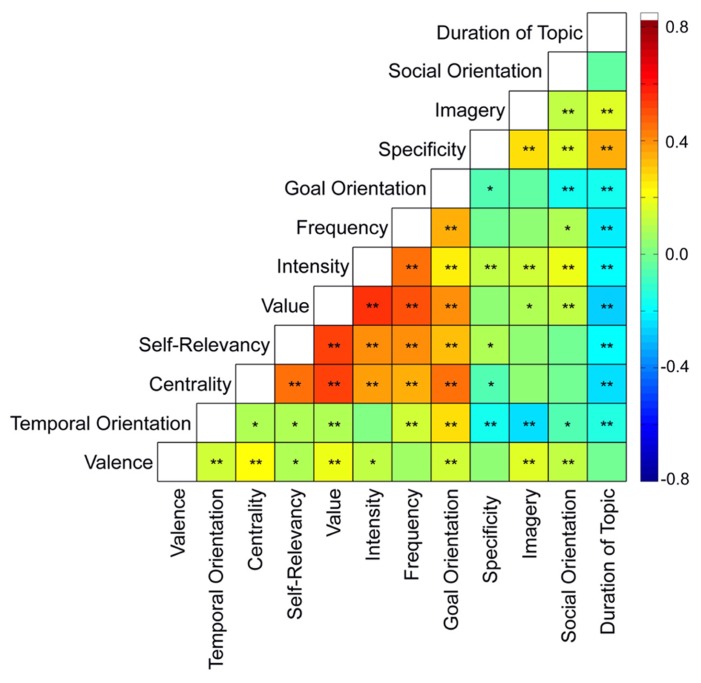
FIGURE 2.
Relationships between content variables. Relationships between content variables were averaged across 76 participants. For scales corresponding to each content variable, see Figure 1 and Table 1. Note that higher scores for Duration of Topic correspond to thoughts concerning topics or events lasting shorter durations. *p < 0.05, **p < 0.0008 (alpha corrected for multiple comparisons using the Bonferroni method).

