
Fig. 2.
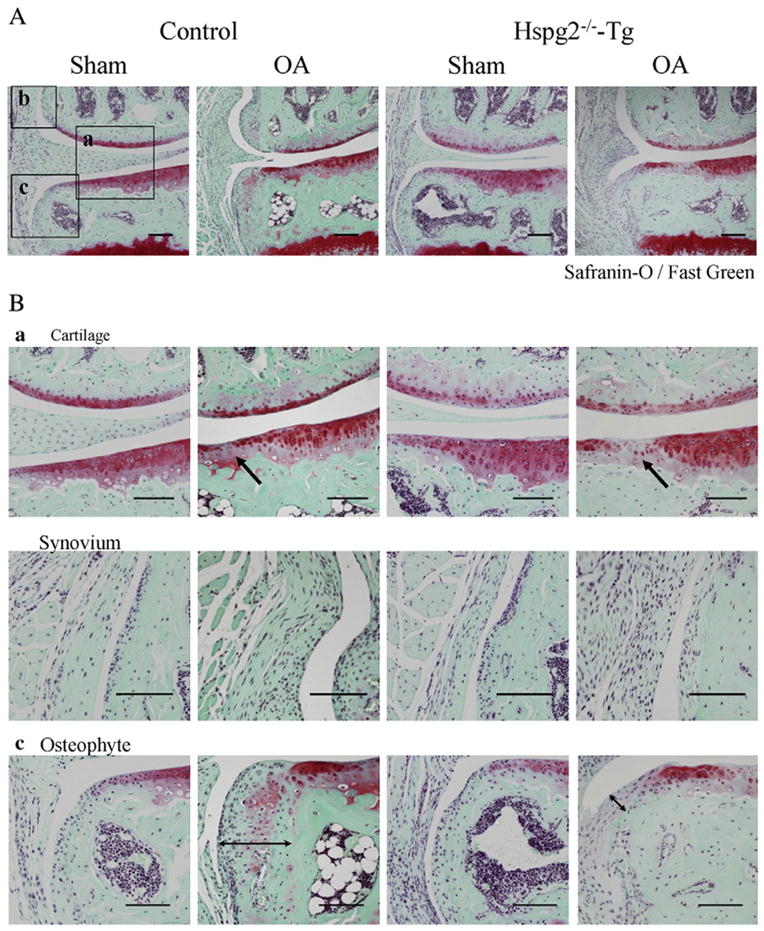

Inhibition of osteophyte formation in Hspg2−/−-Tg mice in the surgical OA model. Histological sections of knee joints 4 weeks after either OA operation (OA) or sham operation (Sham) in control mice and Hspg2−/−-Tg mice (A). High magnifications of cartilage, synovium, and osteophyte areas are shown in (B) a, b, and c, respectively. Boxed areas a, b, and c in (A) indicate representatives of these tissues in each sample. In OA cartilage, the Safranin-O staining regions were reduced in control mice and in Hspg2−/−-Tg mice (arrows in Ba). No histological differences were observed between the synovium in the sham and OA groups of and Hspg2−/−-Tg mice (Bb). Osteophyte formation was inhibited in Hspg2−/−-Tg mice (Bc). Quantitative scores of cartilage degradation (Ca), synovitis (Cb), and osteophyte size and maturity (Cc) were measured according to previous reports (Kamekura et al., 2005; Mapp et al., 2008; Little et al., 2009; Glasson et al., 2010). Cartilage degradation (structural change, Ca, left panel) and proteoglycan staining (Ca, right panel) were significantly increased in control and Hspg2−/−-Tg mice on the OA operation sides (OA) compared with the sham operation sides (Sham). No significant differences were found in the scores between control and Hspg2−/−-Tg mice. However, the osteophyte size and maturity in the OA operation sides (OA) were significantly reduced in Hspg2−/−-Tg mice compared with control mice. The osteophytes are shown with black lines (Bc). Scale bars, 100 μm. All data represent means and SEM.