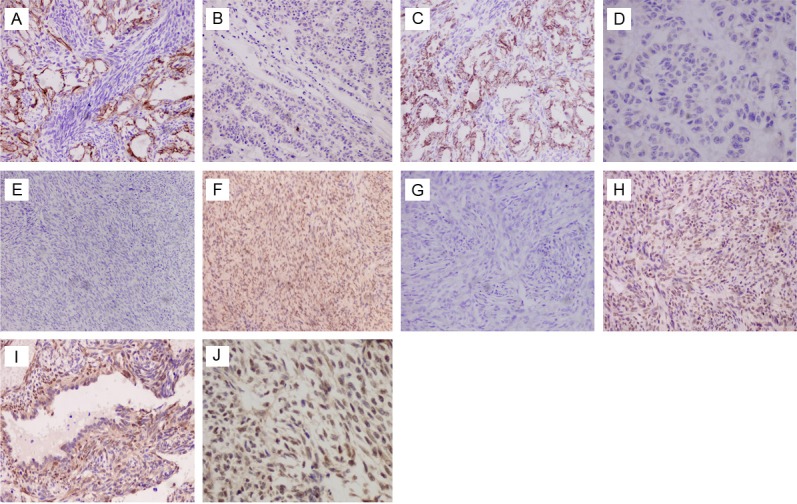
Figure 3.

Representative images depicting correlation between E-cadherin and snail and slug in synovial sarcoma (SS), and β-catenin nuclear staining was observed in some cases. Each pair of images (A-H), representing the correlation between E-cadherin (left column) and snail or slug (right column), are taken from the same tumor sample. A through D, In BSSs, positive E-cadherin expression (A and C: ×200) was significantly associated with down-regulated Snail (B: ×200) and slug (D: ×400) expression. E through H, In MFSSs, lack E-cadherin expression (E and G: ×100) was significantly correlated with positive expression of Snail (F: ×200) and slug (H: ×200). Tumor cells frequently show weak and ⁄ or strong (I, J: ×400) nuclear expression of β-catenin in spindle cells no matter MFSSs or BSSs, but negative in glandular cells (J: ×400).
