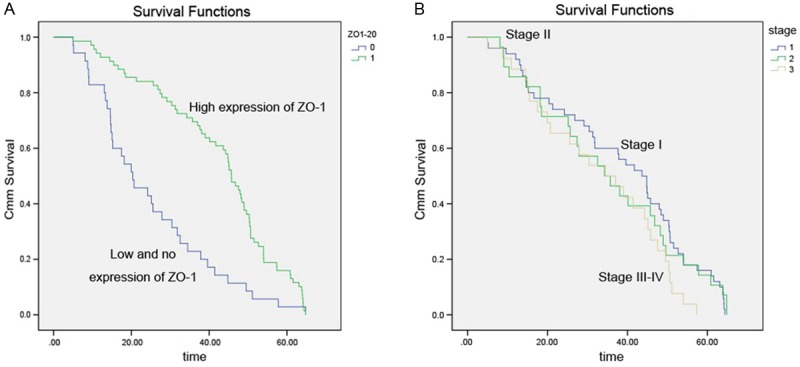
Figure 3.

Kaplan-Meier survival curves following surgical therapy in NSCLC. A: Patients with low or no ZO-1 expression (blue line) exhibited significantly poorer survival compared with the high expression group (green line). B: Kaplan-Meier survival curves demonstrate that life spans of patients with stage III/IV tumors is significantly shorter than those of patients with stage II and stage I.
