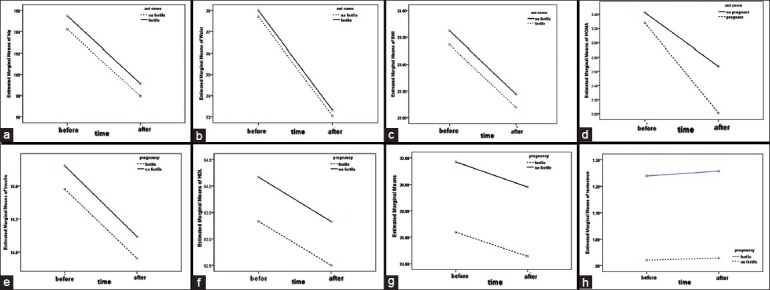
Figure 1.

(a) Hip circumferences changes before and after treatment. (b) Waist circumferences changes before and after treatment. (c) Body mass index changes before and after treatment. (d) Homeostatic model assessment changes before and after treatment. (e) Insulin changes before and after treatment. (f) FBG changes before and after treatment. (g) HSBG changes before and after treatment. (h) Testosterone changes before and after treatment
