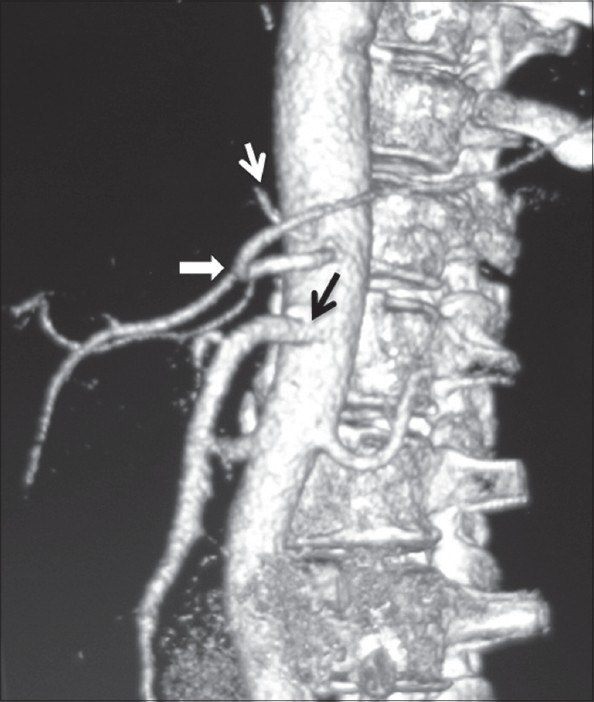
Figure 2.

Volume-rendered image showing anatomic variation of the celiac axis (LG + HSp + SMA) with LGA (white arrow) arising from aorta, hepatosplenic trunk (arrowhead), and separate origin of SMA (black arrow)

Volume-rendered image showing anatomic variation of the celiac axis (LG + HSp + SMA) with LGA (white arrow) arising from aorta, hepatosplenic trunk (arrowhead), and separate origin of SMA (black arrow)