
Figure 1.
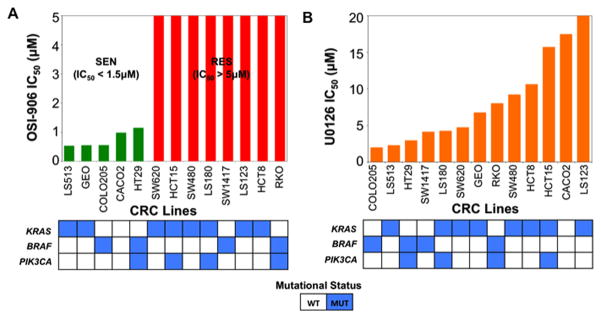
Proliferative effects on 13 CRC cell lines plotted as IC50 following exposure to (A) OSI-906 (0–5 μmol/L), or (B) U0126 (0–20 μmol/L). In the OSI-906 graph, green and red bars represent sensitive (IC50 < 1.5 μmol/L) and resistant (IC50 > 5 μmol/L) cell lines, respectively. Mutational status of KRAS, BRAF and PIK3CA of these cell lines were colored as blue boxes.