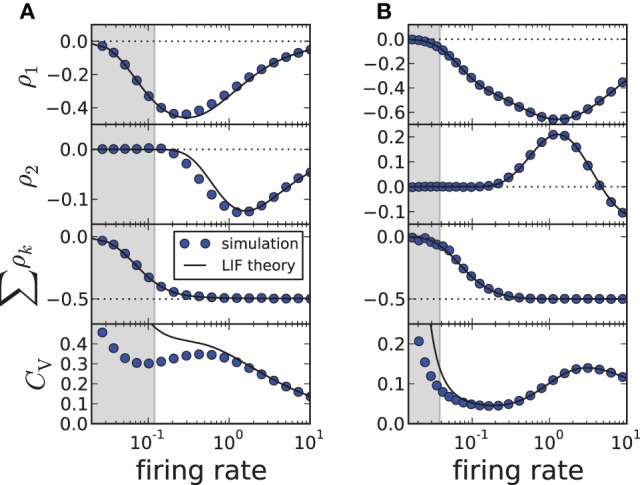
Figure 2.

ISI correlations and coefficient of variation (CV) of the adapting LIF model vs. firing rate 1/〈Ti〉≈ 1/T*, where the rate is varied by increasing μ. The gray-shaded area corresponds to the fluctuation-driven regime (μ < γvT), where the assumptions of the theory do not hold. The panels display (from top to bottom) ρ1, ρ2, the sum and the CV for simulation (circles, m = 100) and theory (solid lines, m → ∞). (A) Moderate adaptation: Δ = 1, (B) strong adaptation: Δ = 10. Both: γ = 1, τa = 10, D = 0.1, vT = 1. Note that the firing rate is given in units of the inverse membrane time constant τ−1m.
