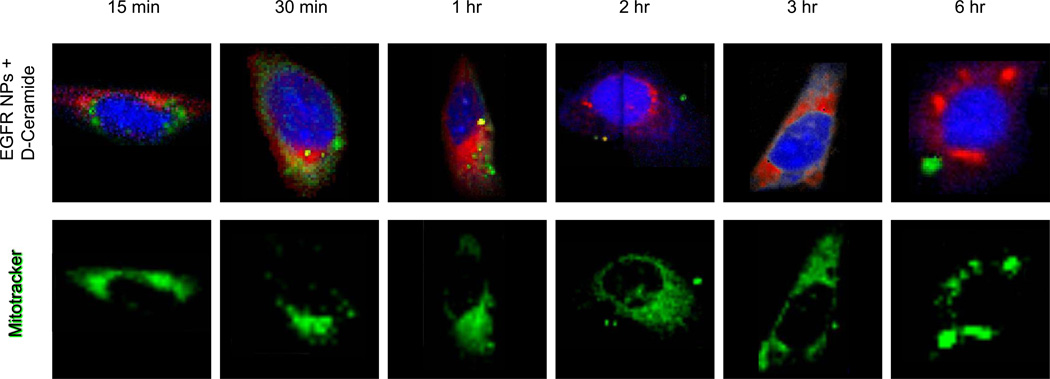
Figure 6.
Top row: Raman images of single SKOV-3 cells incubated with EGFR-targeted PLGA-PEG-PCL nanoparticles loaded with D11-C6-ceramide, over enumerated time periods. Single cells were imaged using a confocal Raman micro-spectral system and analyzed using VCA. Pseudo-colored images represent: cell body and nuclei – blue; membrane-rich organelles and vesicles – green; D11-C6-ceramide – red. Bottom row: corresponding cells counterstained after Raman data acquisition with Mitotracker Green. Same microscope setup was used to analyze fluorescence stain, at the same focal plane.

