
Figure 6.
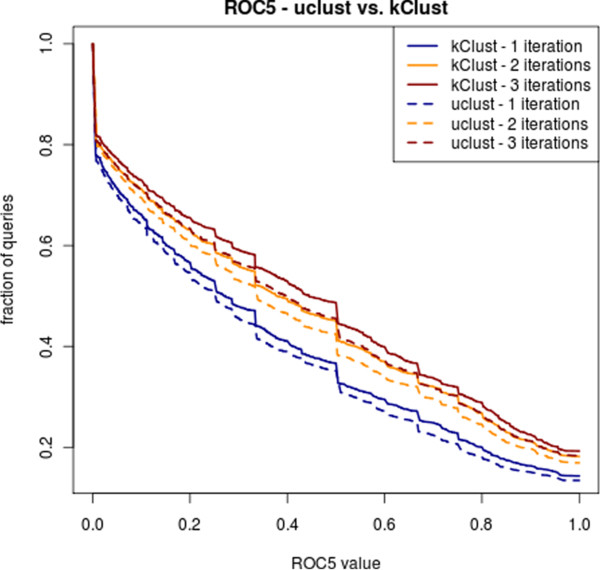
Performance of HHblits on the clustered UniProtKB. Fraction of queries with ROC5 value above the threshold on the x-axis, for one, two, and three HHblits iterations on the test set (5287 sequences from the SCOP 1.73 database). All but the last search iteration are performed against the UniProt. The last search iteration is done through a combined database containing the UniProt and the SCOP sequences. TPs are defined as pairs from the same SCOP folds, FPs as pairs from different folds, with the exception of Rossman folds and β propellers. The ROC5 value is the area under the ROC curve up to the 5th FP, normalized to yield a theoretical maximum of 1. The ROC5 plot is more robust to overfitting than the ROC curves.