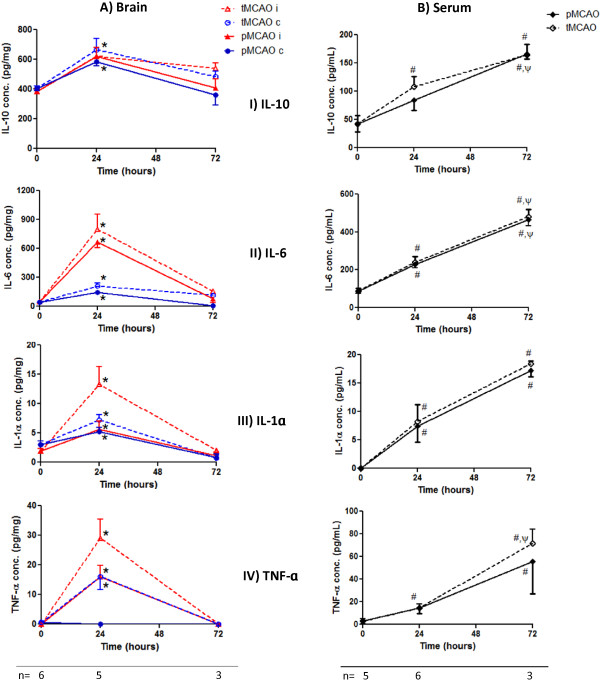
Figure 1.
Cytokines temporal profile in Wistar rat brains and sera after MCAO. (A) Brain cytokine analysis using Bio-plex 200 showed significant IL-10 upregulation by about 50% in both hemispheres at 24 h compared to baseline. Inflammatory cytokines were strongly increased in the ischemic hemisphere at 24 h then subsided at 72 h. (B) Serum cytokine levels showed an ongoing increase at 24 and 72 h. Values are presented as mean ± SEM. i = ischemic hemisphere (red), c = contralesional hemisphere (blue). Solid line represents pMCAO, dashed line represents tMCAO. *, # Significantly different from the corresponding baseline values (p < 0.05), ψ significantly different from the corresponding 24 h values (p < 0.05). Baseline values correspond to sham manipulated animals.

