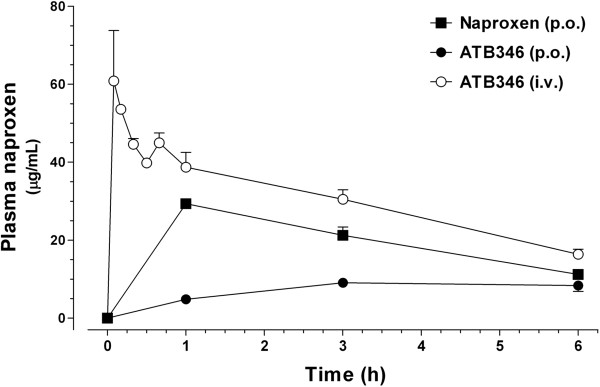
Figure 5.
Pharmacokinetic profiles of circulating naproxen following the administration of single doses of either naproxen or ATB-346 to normal rats. Plasma naproxen concentration vs. time curves were obtained after the administration of equimolar doses of either naproxen (10 mg/kg; p.o) or ATB-346 (16 mg/kg; p.o and i.v) and measurement of the resulting naproxen concentrations by HPLC-MS-MS. Mean plasma concentrations (± SEM; n = 4) are expressed in μg/ml.

