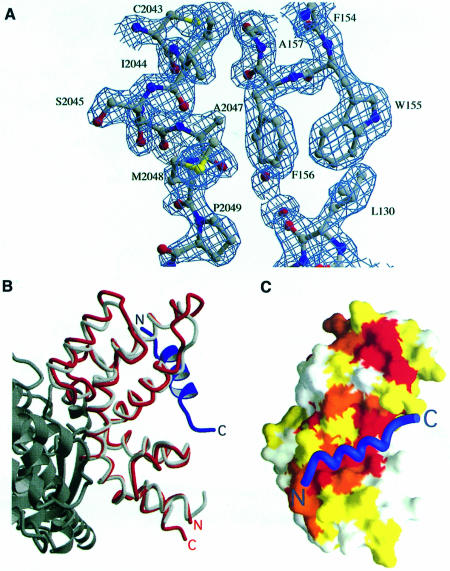
Fig. 5. Structure of the RGS–SAMP3 complex. (A) Final RGS–SAMP3 2Fo – Fc α-calc electron density map in the region of SAMP3 residues Cys2043–Pro2049. The map is contoured at 1σ. (B) The SAMP3-binding site of Axin-RGS is distinct from the Giα-binding site of RGS4. The Axin-RGS–SAMP3 complex is superimposed on the structure of the RGS4–Giα complex. Axin-RGS is red, SAMP3 is blue, RGS4 is light gray and Giα is dark gray. The complex is rotated 90° perpendicular to the page, then 180° around the vertical relative to the orientation of Axin-RGS in Figure 4B. (C) Conservation of the APC-binding surface of Axin-RGS. Surface representation of Axin-RGS, colored by conservation of residues within Axin family members. White indicates that a residue is not significantly conserved, yellow and orange indicate residues that are conserved or conservatively substituted, and red indicates residues that are absolutely conserved in Axin homologs. The SAMP3 peptide Cα trace is drawn in blue. The second conserved patch referred to in the text is visible near the top of Axin-RGS, above the SAMP3-binding site. The complex is rotated 180° around the horizontal relative to its orientation in (B).

An official website of the United States government
Here's how you know
Official websites use .gov
A
.gov website belongs to an official
government organization in the United States.
Secure .gov websites use HTTPS
A lock (
) or https:// means you've safely
connected to the .gov website. Share sensitive
information only on official, secure websites.
