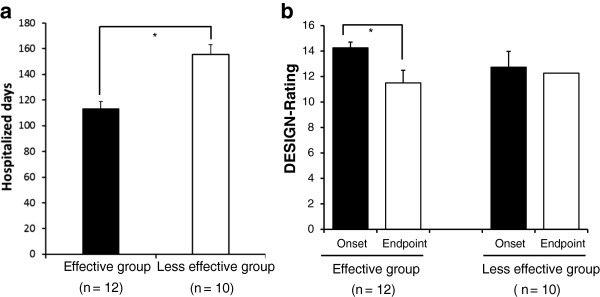
Figure 3.

Comparison of PU clinical effects for the hospitalized days and the DESIGN-rating in the effective group and in the less effective group. Figure 3-a shows the period for the PU hospitalized days in EG was significantly shorter than in LG. Figure 3-b indicates that the DESIGN-rating in EG was decreased for comparing the onset with the endpoint. Pre-post evaluations were performed, where the onset and the endpoint were included. All values are statistically compared. Statistical analysis was performed using Student’s t-test, and the significant differences are defined as p < 0.05. The data are presented as the means with the standard deviation (± SD, indicated by the vertical bar). * p < 0.05.
