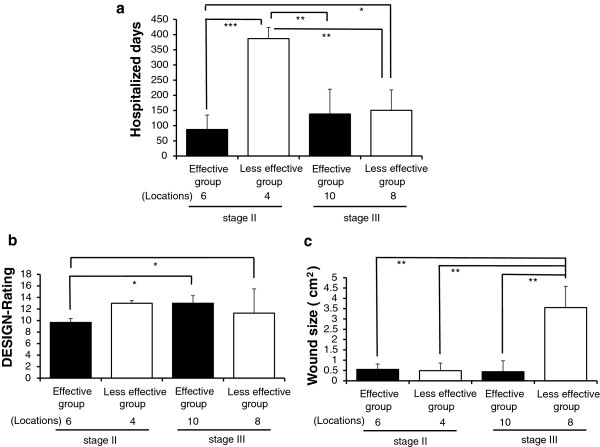
Figure 5.
Expression of various PU-assessment indices forcing on both stage II and stage III. Figures 5-a to -c imply very significant differences among four subgroups based on stage II or stage III. P-values calculated from Student’s t-test, * p < 0.05, ** p < 0.01, *** p < 0.001.

