Figure 8.
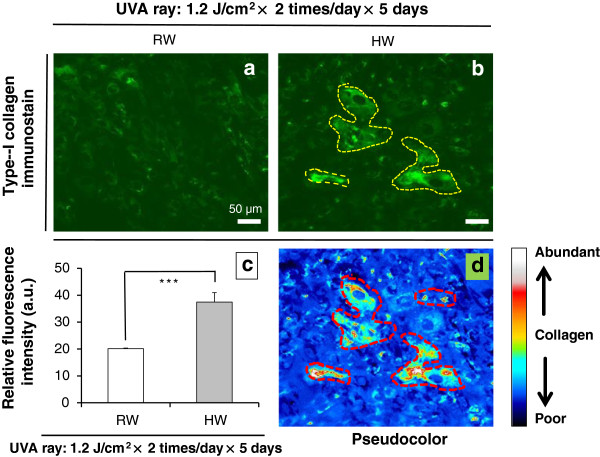
Reconstructive effects of HW in UVA-irradiated OUMS-36 cells. Figures 8-a, -b: Distributional expressions of type-I collagen with immunostain (green) in OUMS-36 cells that were irradiated with UVA ray and were administered with RW or HW, respectively. Figure 8-b: Each yellow dashed lines indicate type-I collagen-rich regions. Figure 8-c: Relative fluorescence intensity plotted with the ImageJ to present the pixel number. Type-I collagen stain on OUMS-36 cells that were irradiated with UVA ray and were administered with RW or HW, respectively, is showed. Figure 8-d: The pseudocolor feature was plotted using ImageJ as an intensity which is corresponding to type-I collagen exhibition degree per one hundred cells (μm2/100 cells). Magnification: ×200; scale bars = 50 μm. Student’s t-test, *** p < 0.001.

