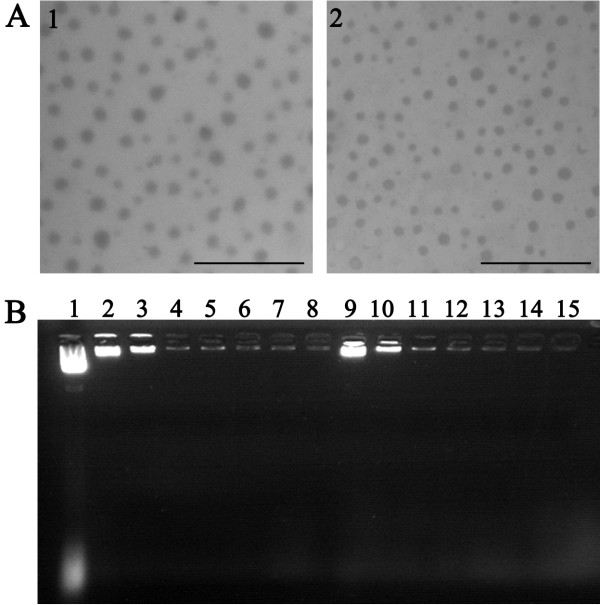
Figure 3.
Characterization of nanoparticle complexes. (A) Transmission electron micrographs. 1, FSH33-G-NP; 2, G-NP. Bar, 500 nm. (B) The encapsulating efficiency as determined by gel retardation assay. Lane 1, naked pDNA; lanes 2 to 8, FSH33-G-NP at the N/P ratios of 1, 5, 10, 15, 20, 25 and 30, respectively; lanes 9 to 15, G-NP at the N/P ratios of 1, 5, 10, 15, 20, 25 and 30, respectively.

