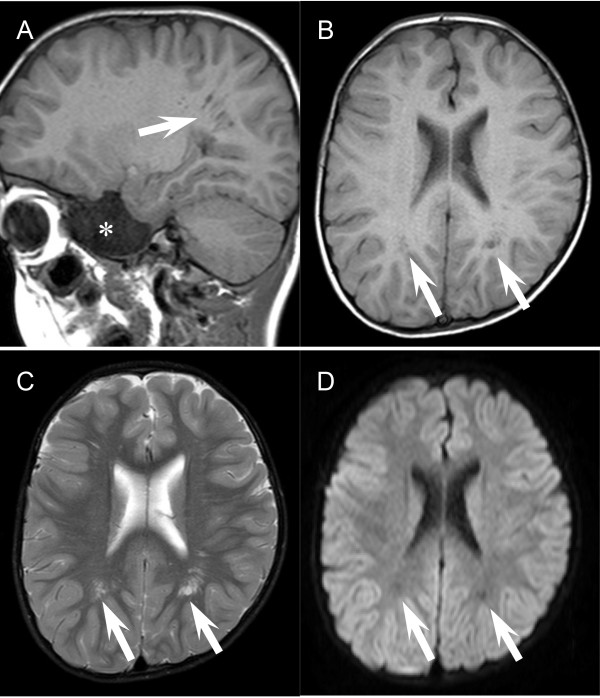
Figure 5.
Enlarged Virchow–Robin spaces in the present case. The sagittal (A) and axial (B-D) views of T1- (A and B), T2- (C) and diffusion-weighted images (D) show the dilated perivascular “Virchow–Robin” spaces (arrows). Note that the dilated perivascular regions exhibit iso-intensity to the fluidal spaces in the lateral ventricle (A-D). Diffusion-weighted images were acquired with the b-factor of 1,000 s/mm2. Asterisk (A) denotes the presence of subarachnoid cyst at the right middle cranial fossa.

