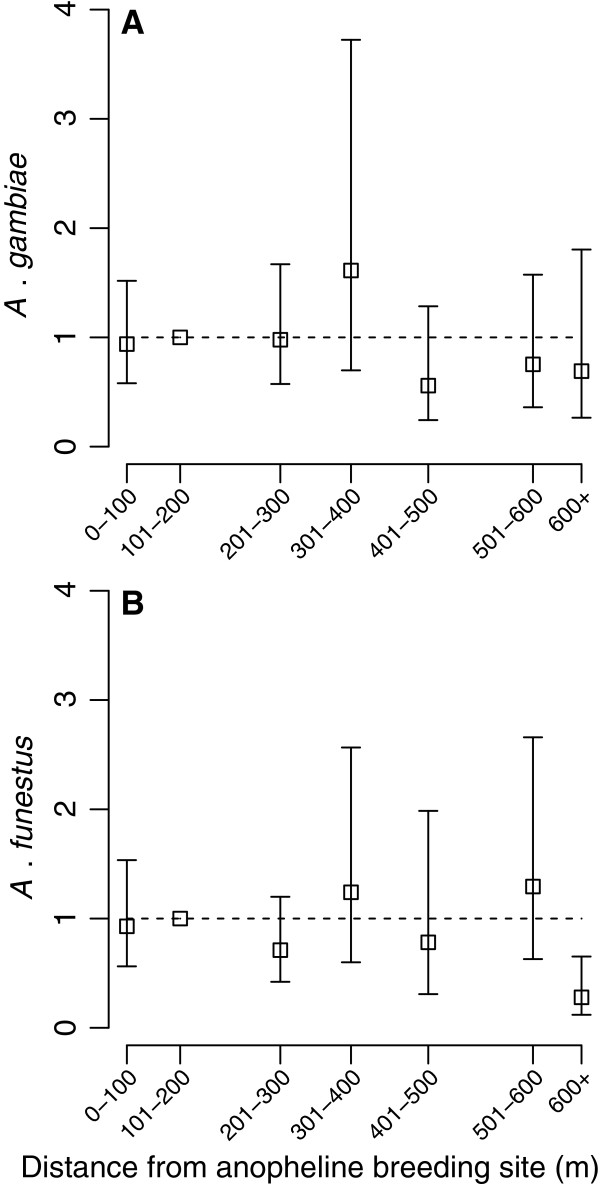
Figure 6.
The association between mosquito density and the distance of a household from the nearest mosquito larval habitat. The squares in each panel (A for A. gambiae and B for A. funestus) represent the model-predicted multiplicative effect on the mean number of mosquitoes per household (mosquito density) associated with the distance of a household from the nearest mosquito larval habitat. Error bars indicate 95% confidence intervals. Squares are plotted at the mean distance within each category.

