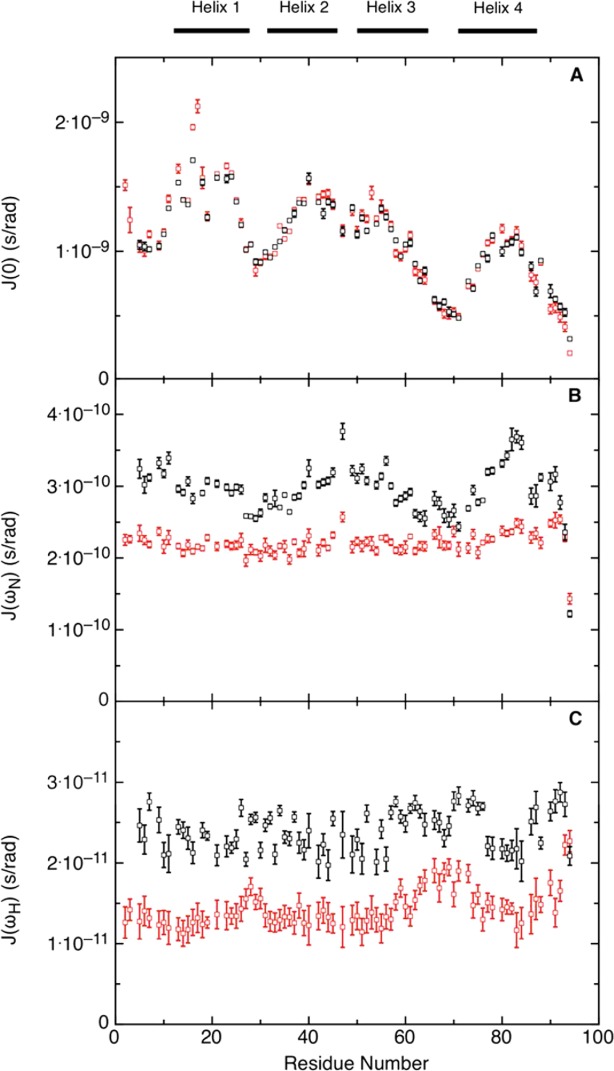
Figure 7.

Reduced spectral density mapping of urea-unfolded Im7H3M3. Data recorded at 600 MHz (black) and 800 MHz (red), at pH 7 and 10°C; (A) J(0), (B) J(ωN), and (C) J(ωH) calculated as described in Materials and Methods. The black bars at the top of the figure indicate the location of the α-helices in the native protein. [Color figure can be viewed in the online issue, which is available at http://wileyonlinelibrary.com.]
