Figure 8.

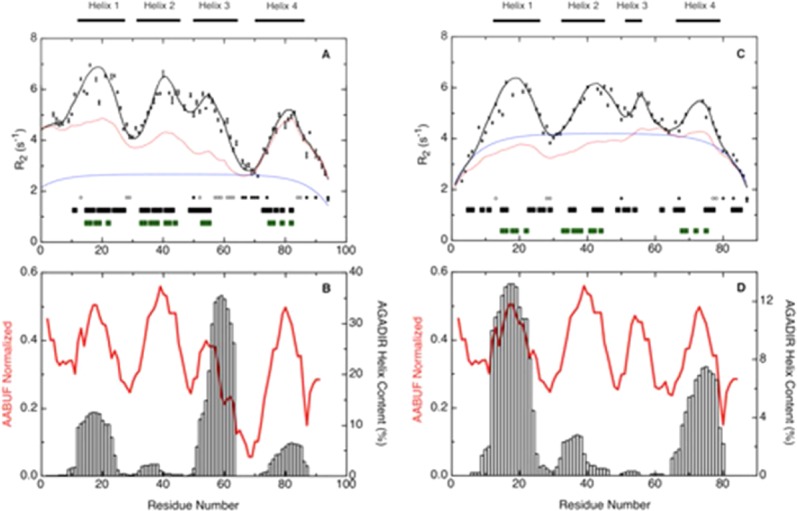
R2 relaxation rates for (A) Im7H3M3 in 6M urea and (C) Im7 in 6M urea, pH 7 and at 10°C, and the average area buried upon folding (AABUF)53 and helix propensity (AGADIR)54 for (B) Im7H3M3 and (D) Im7, plotted as a function of residue number. Measured R2 rates are shown as black squares with error bars; red lines in (A) and (C) shows the R2 values calculated according to the volume-dependent model58 incorporating only the side chain radius of gyration and with persistence length λ0 = 7 except for Gly and Ala for which the value of λ0 was set to 2, and a Gaussian term incorporating four clusters centered at residues Leu 18, Val 42, Gly 56, and Lys 80 (Im7H3M3). The blue lines in (A) and (C) show the R2 values described by the segmental motion model.56,57 Black bars at the bottom of graphs (A) and (C) represent dNN (i, i + 1) NOEs found in the urea-unfolded states; green bars, show hydrophobic clusters predicted by HCA_Draw;55 and the positions of glycine residues (filled circles) and alanine residues (open circles) in the sequence of each protein is indicated. Open vertical bars in (B) and (D), AGADIR54 prediction of helix propensity; the average area buried upon folding (red line) was normalized from 0 to 1 with a window size of seven residues. [Color figure can be viewed in the online issue, which is available at http://wileyonlinelibrary.com.]
