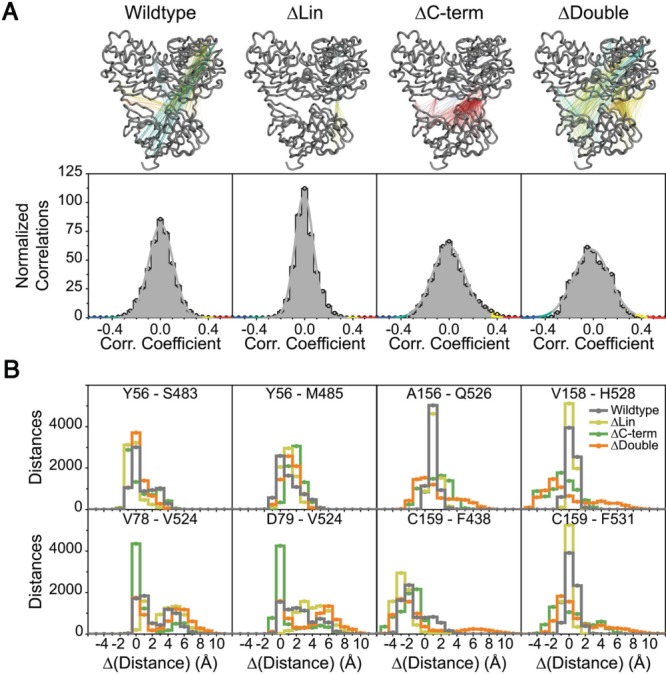
Figure 2.

(A) (Top) Visualized cross correlations for wildtype protein and in silico deletion constructs. Correlations between 0.35 and 0.45 were colored yellow, larger than 0.45 red, between −0.35 and −0.45 cyan, lower than −0.45 blue and remaining gray. (Bottom) Distributions of interdomain correlations for each construct. (B) Pairwise distance difference distribution functions for selected residues across interfaces. Each residue pair contains one residue from the protease and one from the helicase. Distance differences are obtained by subtracting crystallographic distances from the simulation distances. Wildtype protein is represented with gray, ΔLin yellow, ΔC-term green, and ΔDouble orange.
