
Figure 4.
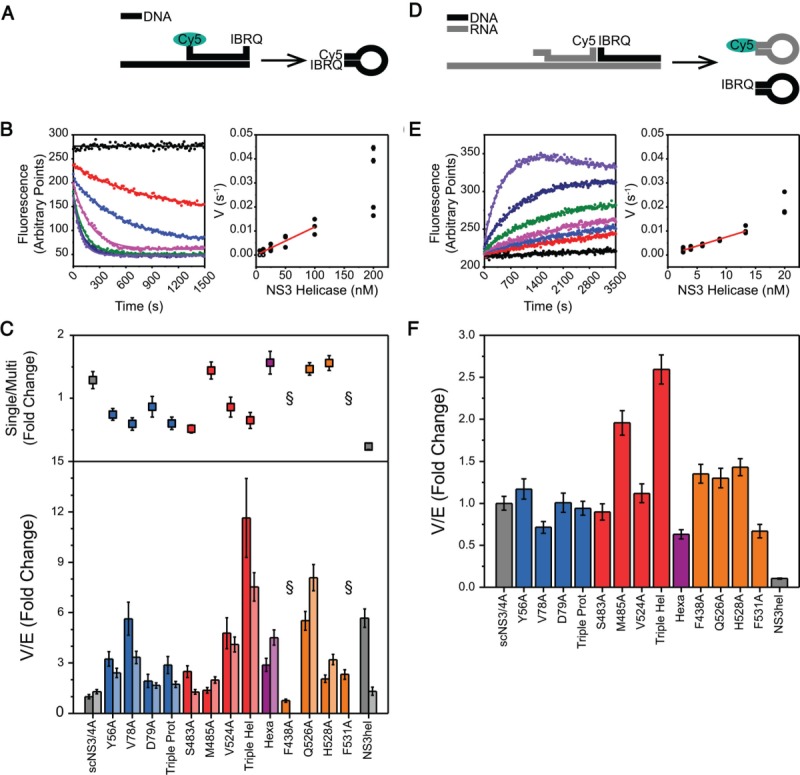
(A) DNA unwinding assay. dsDNA substrate for DNA unwinding assays consists of a top strand labeled with Cy5-IBRQ FRET pair at both ends and a longer bottom strand. Upon strand separation, the top strand self-anneals and Cy5 fluorescence is quenched. (B) (Left) Loss of fluorescence is recorded kinetically (black – no protein, red to purple – increasing protein concentration) and rates were obtained from nonlinear regression. (Right) Rates were plotted against enzyme concentration and linear parts of these curves were fitted concatenately to yield specific rates (V/E) from linear regression. (C) (Top) The difference between multiple and single turnover DNA unwinding assays. For each variant, fold change in activities for the single turnover activities with respect to multiple turnover were calculated. Error bars represent propagated standard errors (n = 3). (Bottom) Specific activities of each helicase variant for multiple turnover (bars) and single turnover (bars) DNA unwinding assays, normalized to scNS3/4A multiple turnover activity. Error bars represent propagated standard errors (n = 3). (D) RNA unwinding assay. dsRNA-DNA hybrid substrate for RNA unwinding assays consists of an RNA Cy5-labeled top strand, a DNA IBRQ-labeled top strand and a long RNA bottom strand. Upon unwinding, both top strands are liberated and self-anneal, resulting in increased Cy5 fluorescence intensity. (E) Gain of fluorescence was recorded kinetically (black – no protein, red to purple – increasing protein concentration) and data analysis were performed similar to DNA unwinding assay. (F) Specific activities of each helicase variant for RNA unwinding assays, normalized to scNS3/4A. Error bars represent propagated standard errors (n = 4).