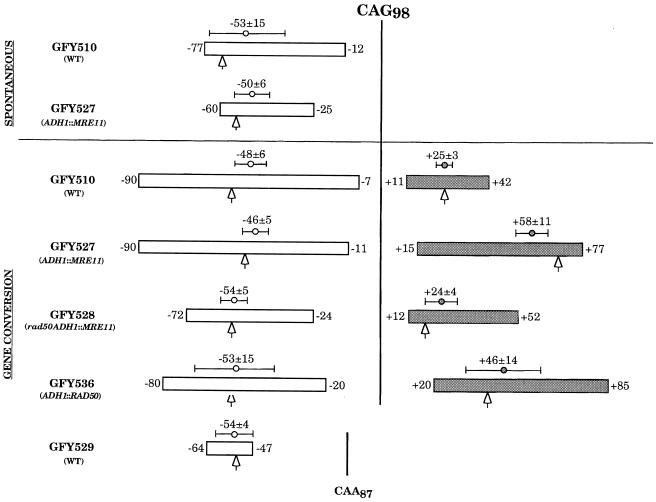
Fig. 3. Trinucleotide repeat size changes after gene conversion using CAG98 or CAA87 as templates. For each strain, the white rectangle indicates the range of contractions detected after DSB repair at the recipient locus on the chromosome. Sizes of the shortest and largest contractions are indicated, respectively, right and left of the rectangle, along with the average contraction size and the standard error. Similarly, the gray rectangle indicates the range of expansions detected after DSB repair. Sizes of the shortest and largest expansions are indicated, left and right of the rectangle, respectively, along with the average expansion size and the standard error. The vertical black lines indicate the original size of the CAG98 or of the CAA87 repeats. The arrows represent the median value of each of the distributions. For CAG98 repeats, the changes in the array arising spontaneously on the donor plasmid sequence are also shown.

An official website of the United States government
Here's how you know
Official websites use .gov
A
.gov website belongs to an official
government organization in the United States.
Secure .gov websites use HTTPS
A lock (
) or https:// means you've safely
connected to the .gov website. Share sensitive
information only on official, secure websites.
