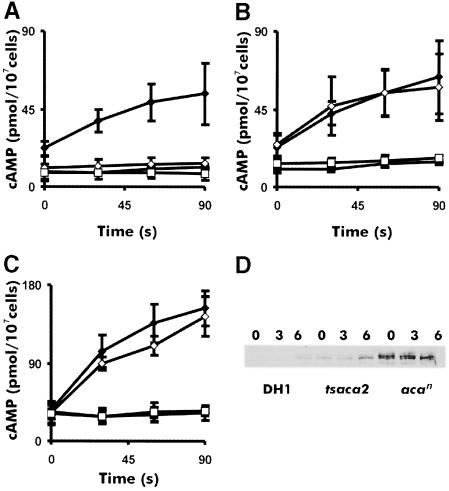
Fig. 4. Temperature sensitivity of basal ACA activity in DH1, acan and tsaca2. ACA activity was measured in cells starved for 4.5 h in the presence of Mg2+ or Mn2+ ions, at 22 and 28°C, for strains tsaca2 (A), DH1 (B) and acan (C). The diamonds are activities measured in the presence of 2.5 mM Mn2+, the squares in the presence of 2 mM Mg2+. The solid symbols are activities measured at 22°C and open symbols are activities measured at 28°C. ACA activity was on average three times higher in acan compared with tsaca2 and DH1. (D) ACA expression in DH1, tsaca2 and acan at 0, 3 and 6 h of development, as determined by Western blot analysis. The results are representative of four experiments. Quantitation of the light emission showed that the level of ACA protein expression in acan was on average seven times higher than in tsaca2, while the levels of ACA in cells of tsaca2 and DH1 starved for 6 h were similar.

An official website of the United States government
Here's how you know
Official websites use .gov
A
.gov website belongs to an official
government organization in the United States.
Secure .gov websites use HTTPS
A lock (
) or https:// means you've safely
connected to the .gov website. Share sensitive
information only on official, secure websites.
