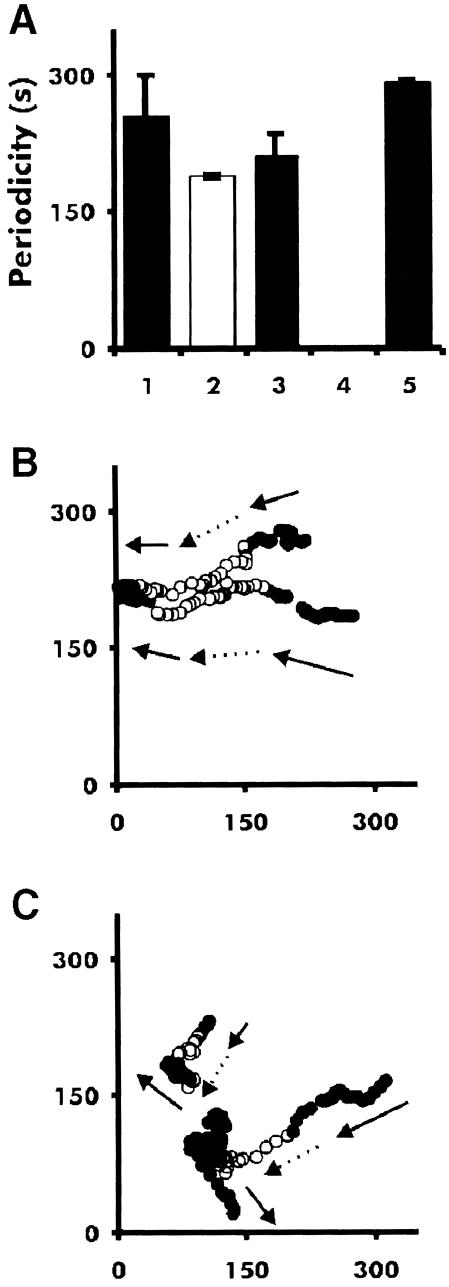
Fig. 6. Period of dark field waves and cell movement in tsaca2 and DH1 at 22 and 28°C. Periodicity was measured during aggregation (A). Bar 1 is the period of DH1 at 22°C, bar 2 is the period at 28°C, bar 3 is tsaca2 at 22°C, bar 4 is tsaca2 at 28°C (where no waves were measured) and bar 5 is the period of tsaca2 after return to 22°C. The data are the mean of at least three experiments. (B) Tracks of two cells in an aggregation field of DH1 cells during a temperature shift experiment. Solid symbols: movement at 22°C; open symbols: movement at 28°C. (C) Tracks of two cells in a field of aggregating tsaca2 cells. The arrows mark the direction of movement of the cells. At the elevated temperature the cells lose their sense of direction. Images were taken every 20 s and, for clarity, the location of the centre of mass of each cell is show in every fourth image (80 s).

An official website of the United States government
Here's how you know
Official websites use .gov
A
.gov website belongs to an official
government organization in the United States.
Secure .gov websites use HTTPS
A lock (
) or https:// means you've safely
connected to the .gov website. Share sensitive
information only on official, secure websites.
