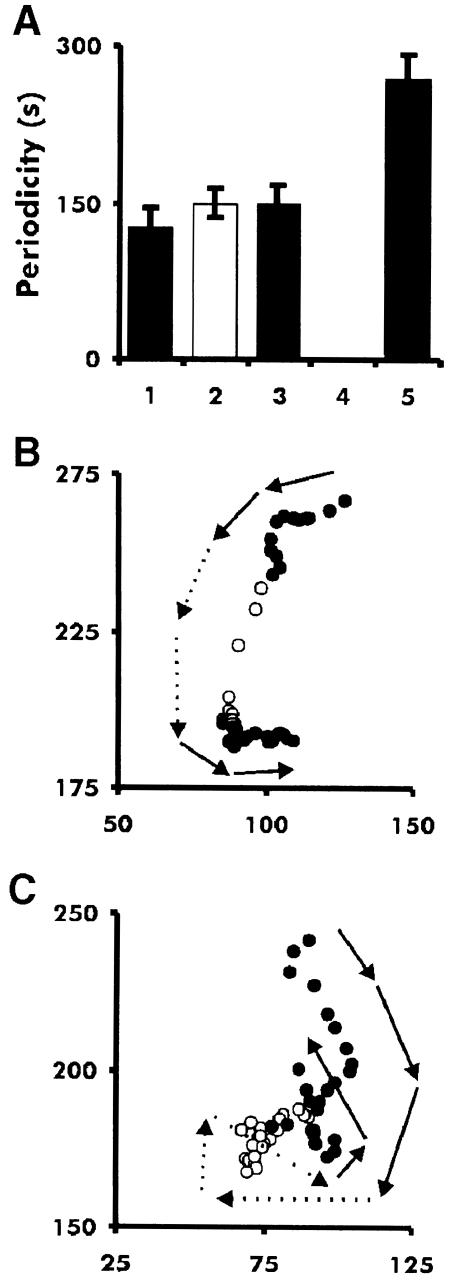
Fig. 8. Period of dark field waves and persistence of cell movement in tsaca2 and DH1 at 22 and 28°C. (A) Periods of OD waves in mounds of DH1 and tsaca2 at 22 and 28°C. bar 1 is the period of DH1 at 22°C, bar 2 is the period at 28°C, bar 3 is tsaca2 at 22°C, bar 4 is tsaca2 at 28°C (where no waves were measured) and bar 5 is the period after return to 22°C. Data are means of at least three experiments. (B) Tracks of a fluorescently labelled DH1 cell at 22°C (solid symbols) and 28°C (open symbols) and the same for tsaca2 (C). The arrows show the direction of cell movement. The images were taken every 20 s; for clarity, the location of the centre of mass of each cell is shown every fourth image (80 s).

An official website of the United States government
Here's how you know
Official websites use .gov
A
.gov website belongs to an official
government organization in the United States.
Secure .gov websites use HTTPS
A lock (
) or https:// means you've safely
connected to the .gov website. Share sensitive
information only on official, secure websites.
