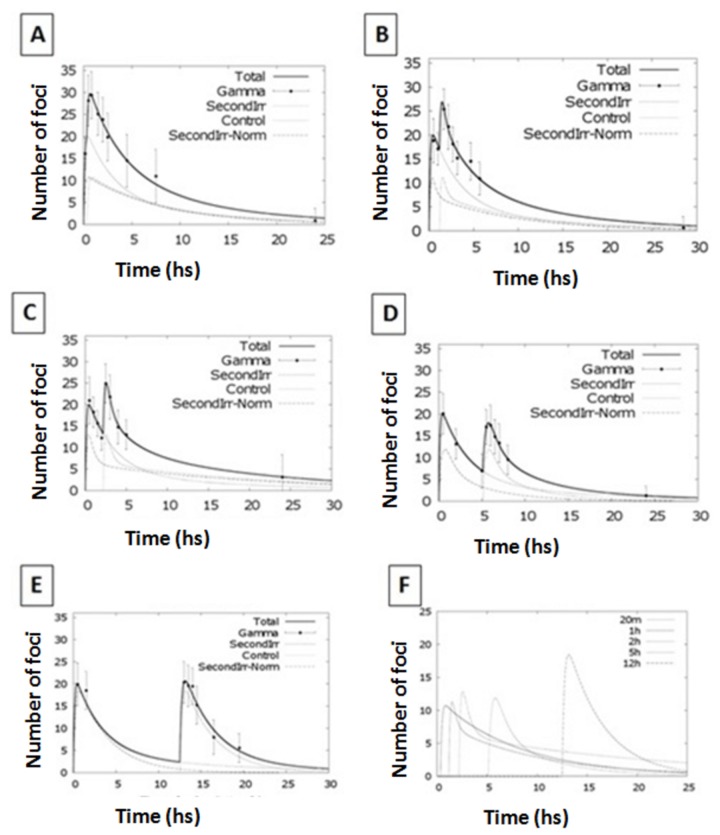
Figure 5. Fitting kinetics for split dose irradiation exposures.
Number of γ-H2AX foci per cell after exposure to 1 Gy at time 0 plus 1 Gy delivered 20 minutes, 1 hr, 2 hr, 5 hr or 12 hr later using 225 kVp X-rays. Solid line represents the modelling function for the split dose scenario. Dotted lines represent the modelling function for the individual radiation exposures. Kinetics for the second exposure only are reported in the last panel.

