
Figure 6. Clonogenic data survival following single and split dose irradiations.
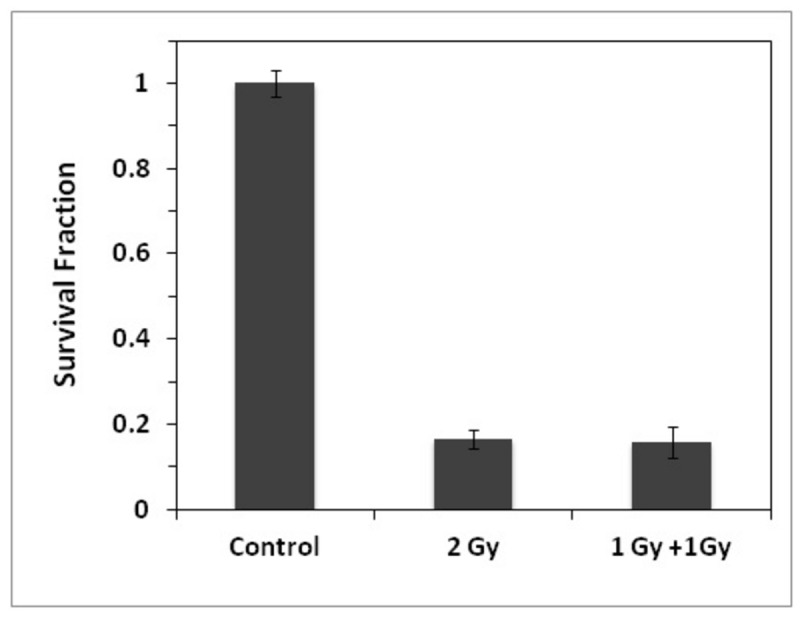
Comparison of clonogenic survival following acute (2 Gy) and split dose (1 Gy + 1 Gy) exposures with 1 hr time gap. Error bars represent the standard error of the mean of 3 independent experiments.