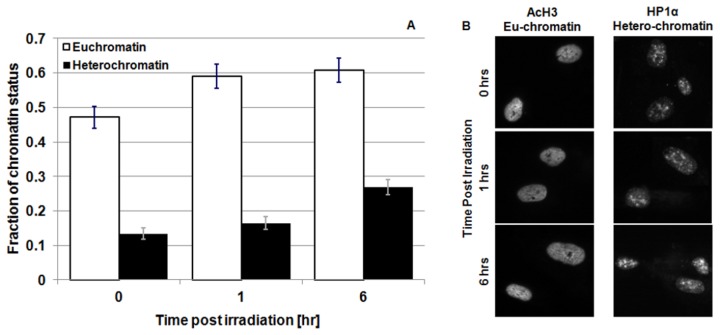
Figure 7. Eu/hetero-chromatin change following radiation exposure.
Panel A: Amount of eu- (acH3 staining - light bars) and hetero-chromatin (HP1α. staining - dark bars) in cell nuclei as a function of time after 1 Gy of 225 kVp X-rays irradiation of 3 independent experiments. The analysis of the experimental data has been performed with a symmetric T-Student test. Panel B: Representative picture of eu- and hetero-chromatin staining .

