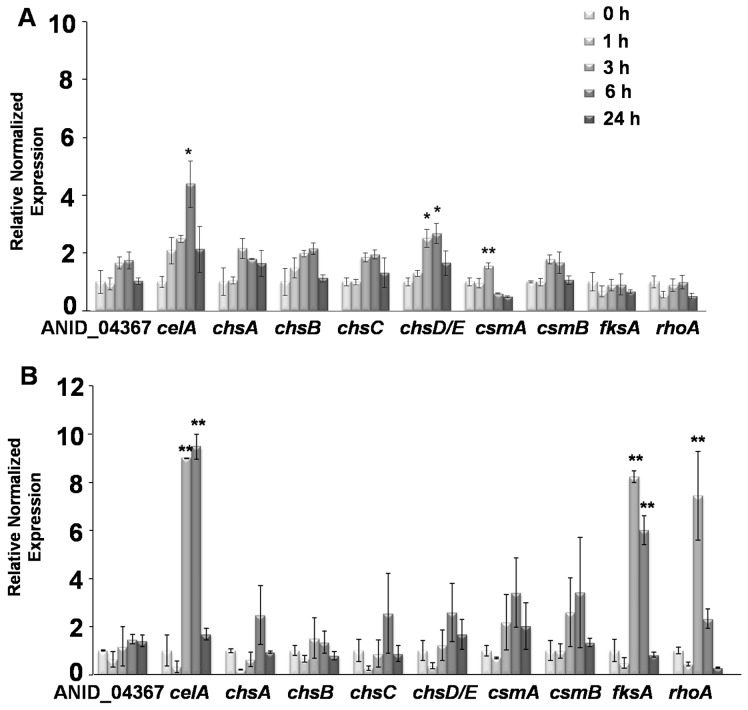
Figure 4. Gene expression analysis in CR and DCB-treated mycelium.
Quantitative real-time PCR analysis of cell wall biosynthetic genes in A. nidulans grown in the presence of (A) 100 µM CR and (B) 200 µM DCB for 0, 1, 3, 6 and 24 h. Asterisks indicate significant (*) and very significant (**) changes.

