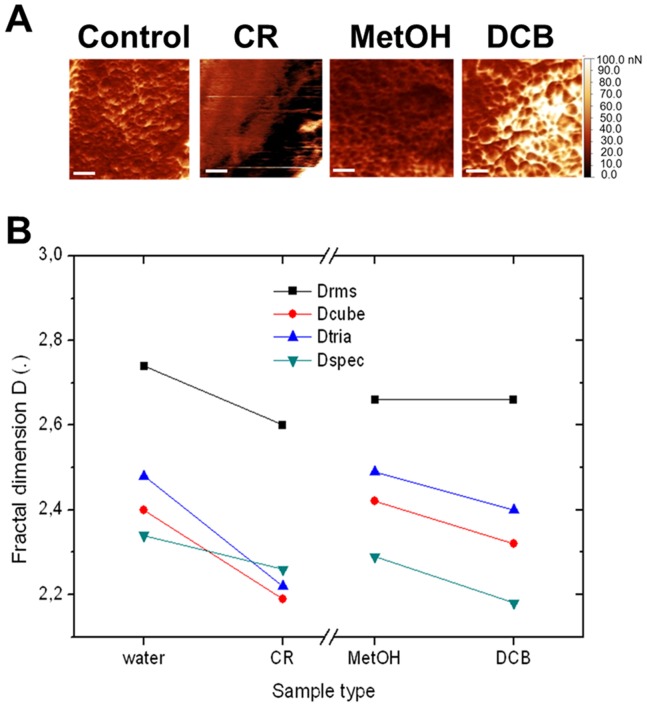
Figure 8. Fractal analysis of AFM images.
(A) Close-up of the adhesion maps in Fig. 6 on the hyphal surfaces. Scale bars refer to 0.5 µm. (B) Plot representing the fractal dimension D obtained from the images in (A) according to different calculation tools available in Gwyddion, namely: Drms from root mean square of adhesion values, Dcube and Dtria from differently shaped (cube or tetragonal) boxes used for coverage of the image surface, and Dspec from Fourier spectrum of the spatial frequencies contained in the image.

