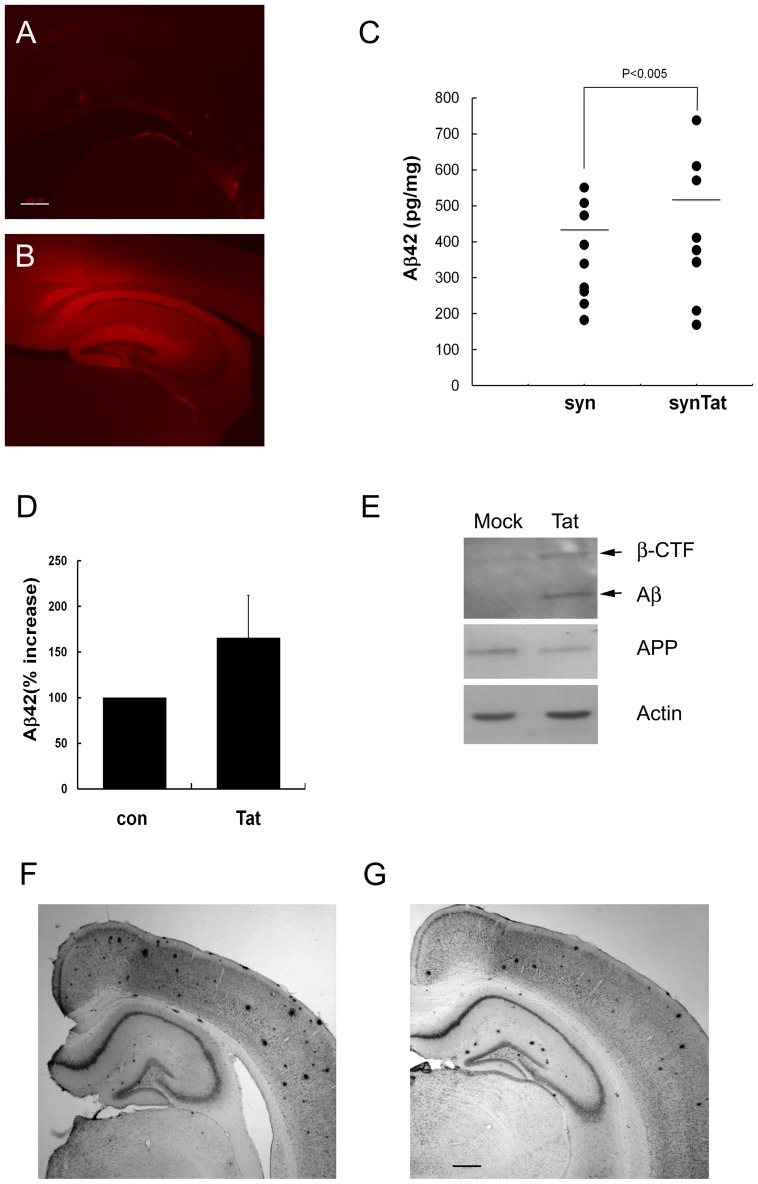
Figure 5. HIV-1 Tat increases Aβ levels and the number and size of amyloid plaques in the APP/PS1 mouse hippocampus.
Mock (A) or syn-Tat (B) was injected stereotaxically into APP/PS1 mouse hippocampi. At 2 months after injection, half of the brain was frozen-sectioned and stained with anti-Tat antibody, and then visualized under an inverted phase fluorescence microscope. Scale bar = 50 µm. (C) Mouse hippocampi (n = 9) injected with mock (syn) or Tat (syn-Tat) were dissected, homogenized 4 months after injection, and Aβ42 levels in the hippocampus extracts were examined by ELISA. The Aβ42 concentration for each mouse is shown on the y-axis, and the injected virus is indicated on the x-axis. (D) Equal volumes of syn-Tat and Lenti-Tat were mixed and injected unilaterally into the mouse hippocampus (n = 5). After 4 months, the hippocampus was dissected from mock (con)- and mixed Tat (Tat)-virus-injected hemispheres, and Aβ42 levels were investigated by ELISA. Aβ42 levels were 1.6-fold higher in the Tat-expressing hemisphere of mouse hippocampi (P<0.001). (E) Representative Western blots for the detection of Aβ. Twenty micrograms of mouse hippocampus extract were separated on 16.5% Tris-Tricine PAGE gels followed by Western blotting with anti-APP (6E10) antibody. Five micrograms of hippocampus extract were used for Western blotting for APP and actin. (F, G) Representative photographs of the Aβ plaque burden in APP/PS1 mice are shown. Brain sections of APP/PS1 mice injected with mock (F) or Lenti-Tat (G) virus were stained with anti-Aβ antibody (6E10). Scale bar = 50 µm.

