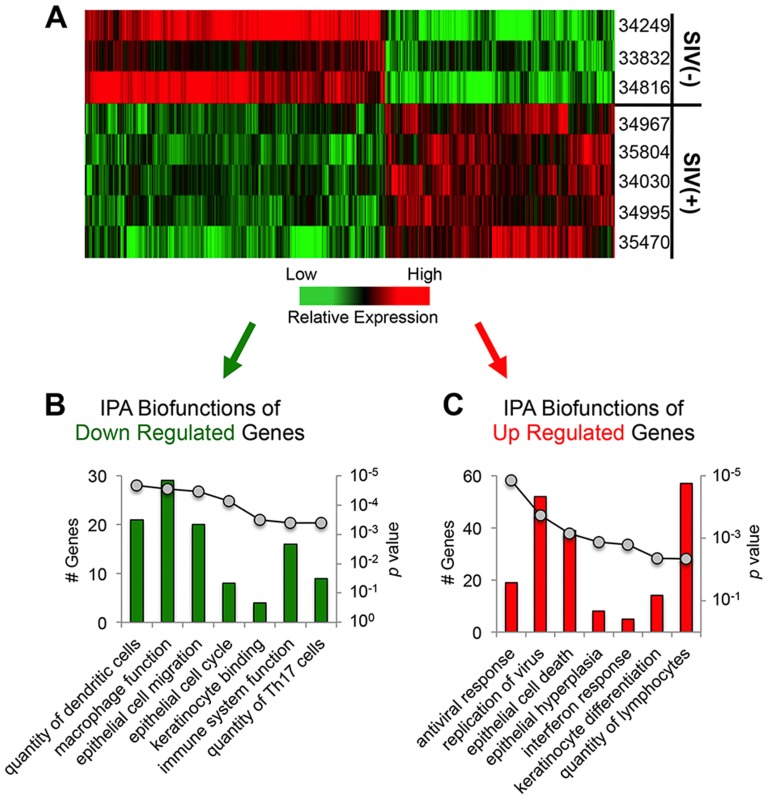
Figure 5. Gene expression profiling of the lingual mucosa in SIV infected macaques.
A) Hierarchical clustering of genes differentially expressed (+/− 1.5 fold-difference and p<0.05) in the lingual mucosa of SIV infected animals and healthy controls as determined by microarray analysis. B) Pathway analysis of genes down-regulated in the lingual mucosa of SIV infected macaques. C) Pathway analysis of genes up-regulated in the lingual mucosa of SIV infected animals. Note: The number of genes in each functional category is shown in bar graphs on the primary y-axis and corresponding p values as a line graph on the secondary y-axis. Pathway analysis was performed with Ingenuity Pathway Analysis (IPA©) software.

