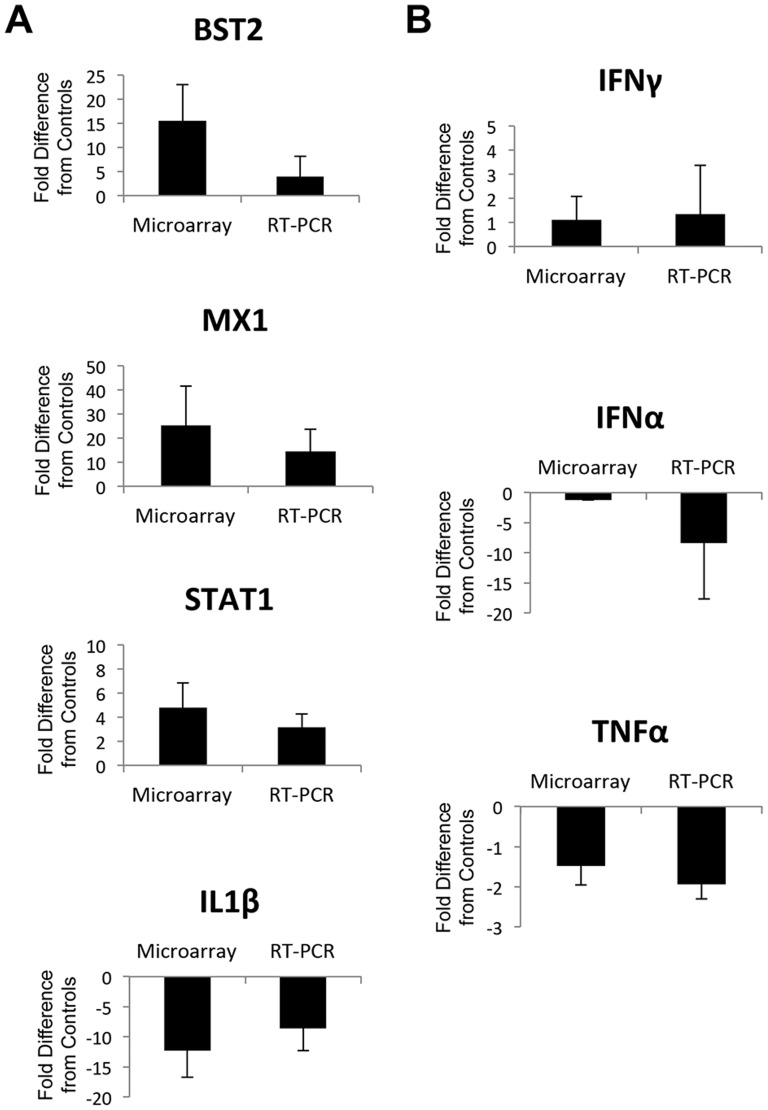
Figure 9. Validation of microarray data by quantitative real-time PCR.
A) Comparison of fold changes in expression of BST2, MX1, STAT1, and IL1β in the tongue of SIV infected animals as determined by quantitative real-time PCR (RT-PCR) and microarray-based assays. B) Comparison of microarray and RT-PCR-based changes in expression of pro-inflammatory cytokines IFNγ, IFNα, and TNFα in the tongue of SIV infected macaques. Notes: error bars denote standard deviation of fold change in each system. RT-PCR data were generated from comparison of 3 SIV infected animals to 3 uninfected controls, and microarray data from comparison of 5 SIV infected animals to 3 uninfected controls.

