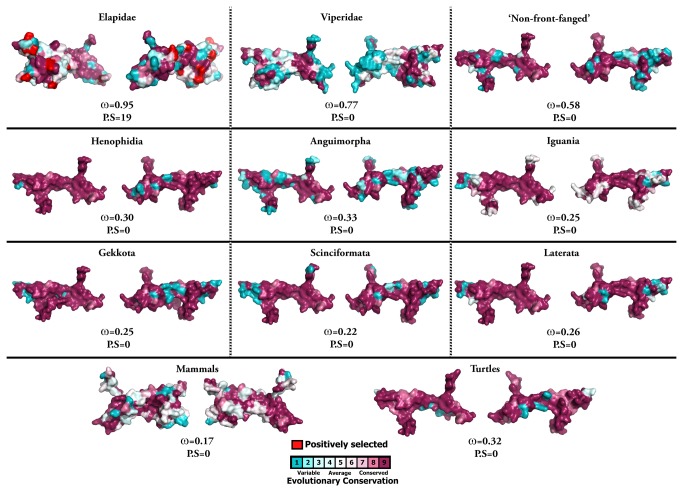
Figure 4. Molecular evolution of nerve growth factors.
Three-dimensional homology models of nerve growth factors, depicting the locations of positively selected sites (in red). The ω values (Model 8) for the respective taxa along with the number of positively selected sites (PP ≥ 0.95, Bayes-Empirical Bayes approach) are indicated.

