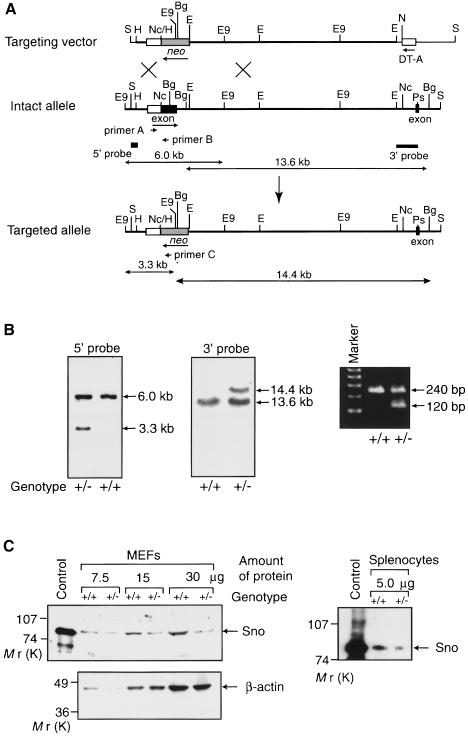
Fig. 1. Generation of sno-deficient mice. (A) Diagrammatic representations of the mouse sno locus and targeting construct. The protein-coding regions of the two exons containing the N-terminal region of SnoN (amino acids 1–362) and the following 33 amino acid region are shown as closed boxes, while the 5′-untranslated region is indicated by an open box. The thick line indicates the genomic DNA, whereas the thin line shows the vector backbone. The neomycin resistance gene (neo) was inserted into the exon encoding the N-terminal region (amino acids 1–362). The probes used for Southern blot analyses are shown together with the predicted sizes of the hybridizing fragments. The three primers used for PCR are also indicated. B, BamHI; Bg, BglI; E, EcoRI; E9, EcoO109I; H, HindIII; Nc, NcoI; Ps, PstI; S, SalI. (B) Examples of genomic Southern blot (left and center panel) and PCR (right panel) analyses of wild-type (+/+) and heterozygous (+/–) mutant mice. Genomic DNA was isolated from the tails of mice and digested with EcoO109I or BglI for Southern blot analysis using the 5′ or 3′ probe, respectively. PCR was performed using the primers shown in (A). (C) Immunodetection of Sno protein. Extracts from wild-type (+/+) or sno+/– (+/–) MEFs or splenocytes were used for Western blotting with anti-Sno antibodies (above left). Extract from 293T cells transfected with the Sno expression vector was used as a control. To confirm equal loading of total protein in all lanes for MEFs, Western blotting was also carried out with an anti-actin antibody (below left). The loading of protein from splenocytes was adjusted by measuring protein concentrations using a dye-binding method.

An official website of the United States government
Here's how you know
Official websites use .gov
A
.gov website belongs to an official
government organization in the United States.
Secure .gov websites use HTTPS
A lock (
) or https:// means you've safely
connected to the .gov website. Share sensitive
information only on official, secure websites.
