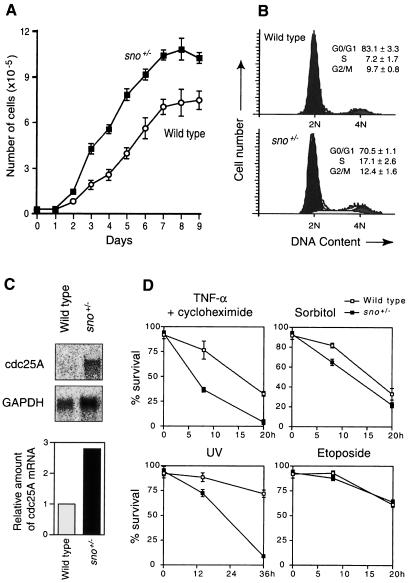
Fig. 6. Growth advantage conferred on MEFs by the loss of one copy of sno. (A) Growth curves of MEFs. The average and standard deviation of triplicate measurements are shown for each time point. (B) Cell cycle analysis. Exponentially growing MEFs were stained with propidium iodide and analyzed by FACScan. The average population and standard deviation of triplicate measurements are shown. (C) Expression of cdc25A. Poly(A)+ RNA was isolated from confluent MEFs and expression of cdc25A and GAPDH was analyzed by Northern blotting. The amount of cdc25A mRNA was normalized with respect to the GAPDH mRNA level, and the relative amount is indicated as a bar graph. (D) Analysis of apoptosis of MEFs. Apoptosis was induced and cells were assayed at the indicated time points. TNF-α (10 ng/ml) and cycloheximide (5 µg/ml); sorbitol (0.4 M); UV irradiation (390 J/m2); etoposide (100 µM). The average and standard deviation of triplicate measurements are shown for each time point.

An official website of the United States government
Here's how you know
Official websites use .gov
A
.gov website belongs to an official
government organization in the United States.
Secure .gov websites use HTTPS
A lock (
) or https:// means you've safely
connected to the .gov website. Share sensitive
information only on official, secure websites.
